Monitoring and Alerting
General Description
The Monitoring and Alerting component is responsible for allowing users to collect data, eg KPIs and other data points from machines, infrastructure, and zApps. The component is also responsible for alerting users and other ZDMP components in case a KPI get out of defined limits, reducing the impact of crises and losses to smart factories.
The different KPIs delivered via the platforms message bus can be configured to be stored in the Storage Component to collect historic data. If historic data is collected, different choices of histograms are presented for the user to choose how the data should be presented.
To be able to notify about potential problems, users can define limits for data points, as well as qualifiers (eg energy consumption is ‘larger than’ & ‘100 kWh’) to trigger alerts, ie SMS, emails, push notifications as well as calls to HTTP endpoints when these limits have been crossed for the first time. These limits are used as goals (for example by Autonomous Computing) where a process can be started if this limit is not reached.
Additional alerts can be sent if the component has not sent a response after a defined time has passed. The receivers should be able to check that the problem has been recognized so the system knows it is already being acted on. If this has not happened after passing a critical value, the system notifies other receivers. A reset timeframe can be created, to indicate a duration in which the data point must be back within the regular defined value to be able to trigger the alert again.
| Resource | Location |
|---|---|
| Source Code | Link |
| Latest Release | Vs 1.0.0 |
| X Open API Spec | Link |
| Video | Link |
| Further Guidance | None |
| Related Datasets | None |
| Additional Links | None |
| Generation date of this content | 06 April 2021 |
Screenshots
The following images are illustrative screenshots of the components:
Component Author(s)
| Company Name | ZDMP Acronym | Website | Logo |
|---|---|---|---|
| Ascora GmbH | ASC | www.ascora.de |  |
Commercial Information
| Resource | Location |
|---|---|
| IPR Link | Monitoring |
| Price | [For determination at end of project] |
| Licence | [For determination at end of project] |
| Privacy Policy | [For determination at end of project] |
| Volume license | [For determination at end of project] |
Architecture Diagram
The following diagram shows the position of this component in the ZDMP architecture
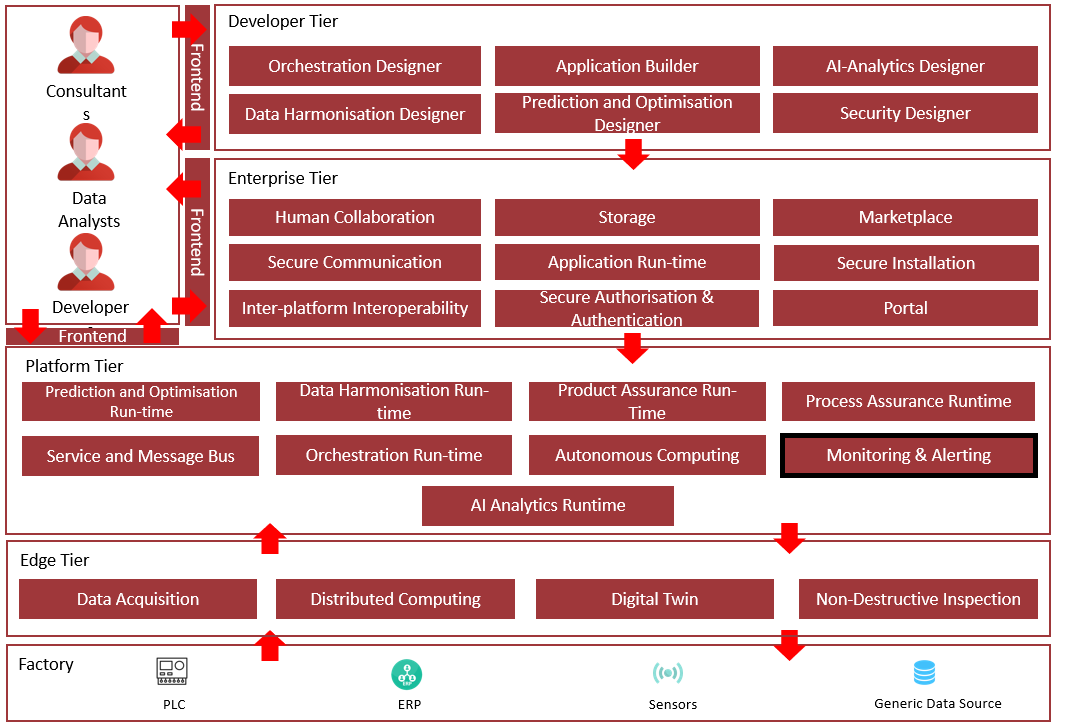
Figure 20: Position of Component in ZDMP Architecture
Benefits
Collect various type of data, eg KPIs and other type of data from machines, sensors, infrastructure and zApps by subscribing to topics in the message bus
Create KPIs and watch its value changes occurring through time
Store the collected data and KPIs in the Storage component and allow to use it for analyses purposes
Notify users when KPI’s values are not within the defined conditions reducing the impact of failures and crises to smart factories
Create and send alerts to user in the form of emails or notifications
Use Grafana to compose observability dashboards with data from Prometheus
Features
This component offers the following features:
Create KPIs
View KPI’s Historic Data
Create Alert
Create Message Template
Send Notification / Send Alert
Create KPIs
Allow the user to create KPIs to extract important values from the data transmitted through the Message Bus. The user needs to specify through which topics the data is extracted from.
View KPI’s Historic Data
Allow the user to see the KPI data and the changes that occurred through time using Grafana and Prometheus.
Create Alert
Allow the user to create Alerts to notify users when the KPI’s values are not within the expected by quality standards or in any other situations where the user wants to be notified if the KPI values meets a certain criterion.
Create Message Template
Allow the user to create a rich text message using KPI properties, like description inside the template to provide a complete message with pertinent real time information.
Send Notification / Send Alert
Allow the user to send an email directly to one or more users, without the need of an alert to do so. This feature is only available in the API and not in the UI, since this feature is intended for other API’s use and not human use.
System requirements
Hardware Requirements:
- 2 CPUs
8GB RAM
64GB disk space
Software Requirements:
- Docker
Associated ZDMP services
Required
Installation
The Monitoring and Alerting component is installed via docker-compose, for that a server for the email credentials and the message bus component credentials is also needed:
- Download the latest docker-compose file from ZDMP’s GitLab
- Add the environment variable values. Choose the way to do it following the instructions from docker: https://docs.docker.com/compose/environment-variables/.
As an example, create a file named ‘.env’ in the same folder of the docker-compose file, with the following information:
EMAIL_SERVER_HOST=http://provider.com
EMAIL_SERVER_PORT=457
EMAIL_SERVER_USER=yourEmailServer@provider.com
EMAIL_SERVER_PASSWORD=yourPassword
MESSAGE_BUS_SERVER=http://yourMessageBusServer.com
MESSAGE_BUS_PORT=PreferredAmpqPort
MESSAGE_BUS_USER=yourMessageBusUser
MESSAGE_BUS_PASSWORD=yourMessageBusPassword
TIME_BETWEEN_NOTIFICATIONS_FROM_SAME_ALERT=60000
MONGO_INITDB_SERVER=DateBaseServer
MONGO_INITDB_DATABASE=DataBaseName
MONGO_INITDB_ROOT_USERNAME=yourDataBaseUserName
MONGO_INITDB_ROOT_PASSWORD=yourDataBasePassword
PUSH_GATEWAY_URL=http://localhost:9091
The TIME_BETWEEN_NOTIFICATIONS_FROM_SAME_ALERT is a value in milliseconds used when the value of a KPI dispatches an Alert, and the KPI value was changed again and would trigger the alert again, a new alert is sent only after TIME_BETWEEN_NOTIFICATIONS_FROM_SAME_ALERT milliseconds from the last alert sent.
- Install and start the component by executing the following command:
docker-compose up -d
How to use
The Monitoring and Alerting component can be used through an API or a friendly user interface.
API: Please refer to http://localhost:28001/api for the Swagger instructions on how to use the API. There are all the possible requests the component accepts, and its expected parameters or body content. The API can be accessed in http://localhost:28001/
User Interface (UI): Access http://localhost:28002 to access the user interface.
KPI
A KPI references a data value that holds a significant meaning for the user, as an example, the length of pencil produced by an automatic machine. As the length of the pencil is one of the keys to measure the quality of the production, we can create an KPI of the length of the Pencil. To create a KPI, the following is necessary:
Description to identify the KPI
Message Bus topics that should be used to extract the KPI value
Data format expected and the query used to extract the data. The possible data types are JSON and XML
Follows is an example, which extracts the length of the pencils produced:

Figure 21 – Create new KPI
The Query is composed of a JSONpath for Json data and xPath for XML data.
After the KPI is created, the item appears in the KPI List View, and is available to be used to create Alerts, or in other components that uses the list of KPI’s saved:
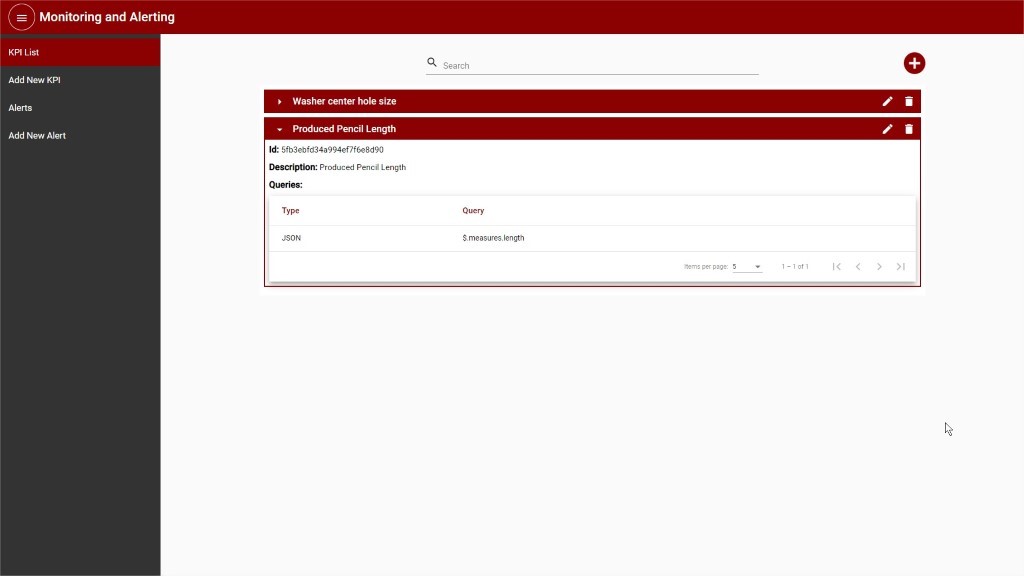
Figure 22 – KPI List View
Alerts
One or more conditions can be applied to KPI’s to ensure the quality of the products, and in case a KPI value indicates a quality failure an Alert can be sent to one or more users. Following the pencil example, an alert can be created when the length of the pencil is outside the range delimited by quality standards.
To create an Alert, the following is necessary:
Description to identify the alert.
Condition that compares the values of one KPI.
When more than one condition is provided, a logic query identifying the relation between the conditions needs to be provided. (See example bellow)
Message to be sent when the conditions are matched.
One or more users to receive the message when the conditions are matched.
The following example alerts a user when the length of the produced pencil is out of the range delimited by quality standards:
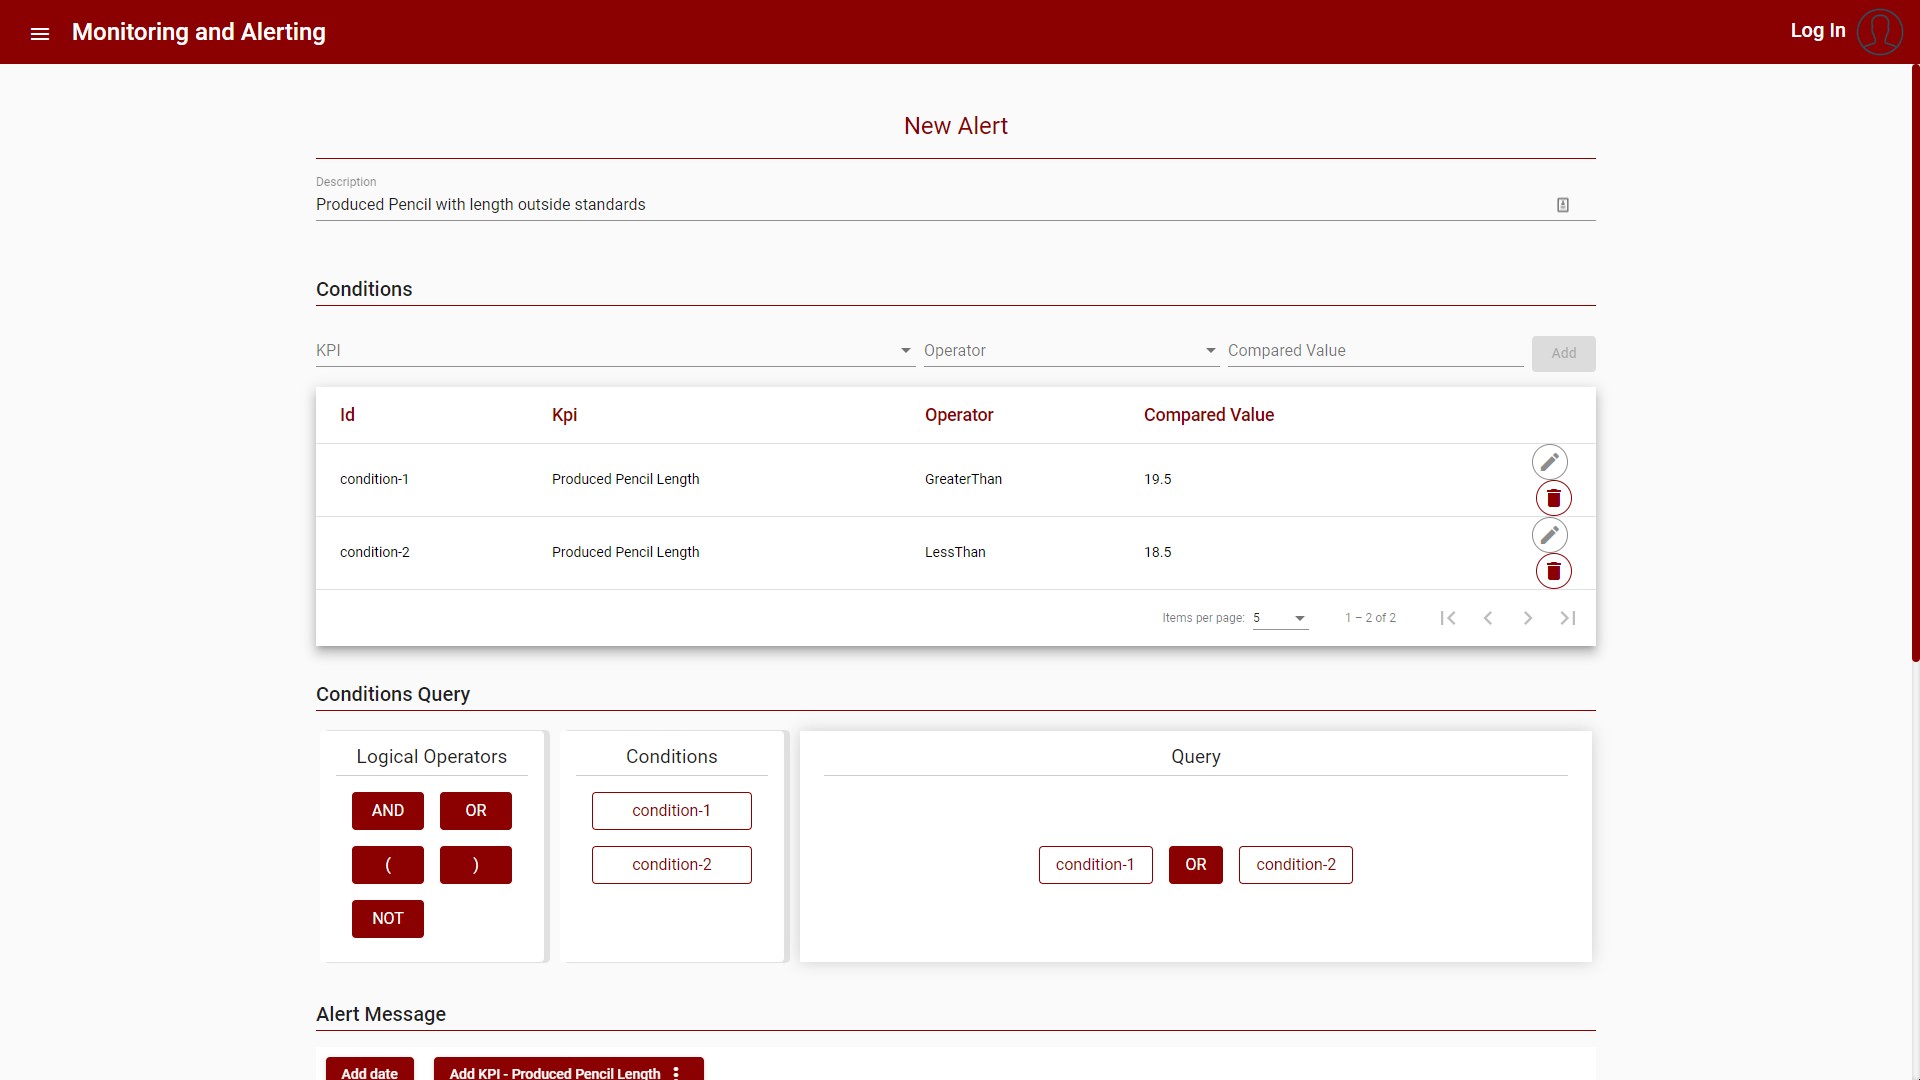
Figure 23 – Create new Alert – Part 1
The Conditions query must be formulated using the conditions identifiers and the logical operators available in the drag and drop UI.
The alert message can include data from the KPI at the time the alert was sent, the buttons in the upper area are used to add these values, like the KPI ID, value, or description:
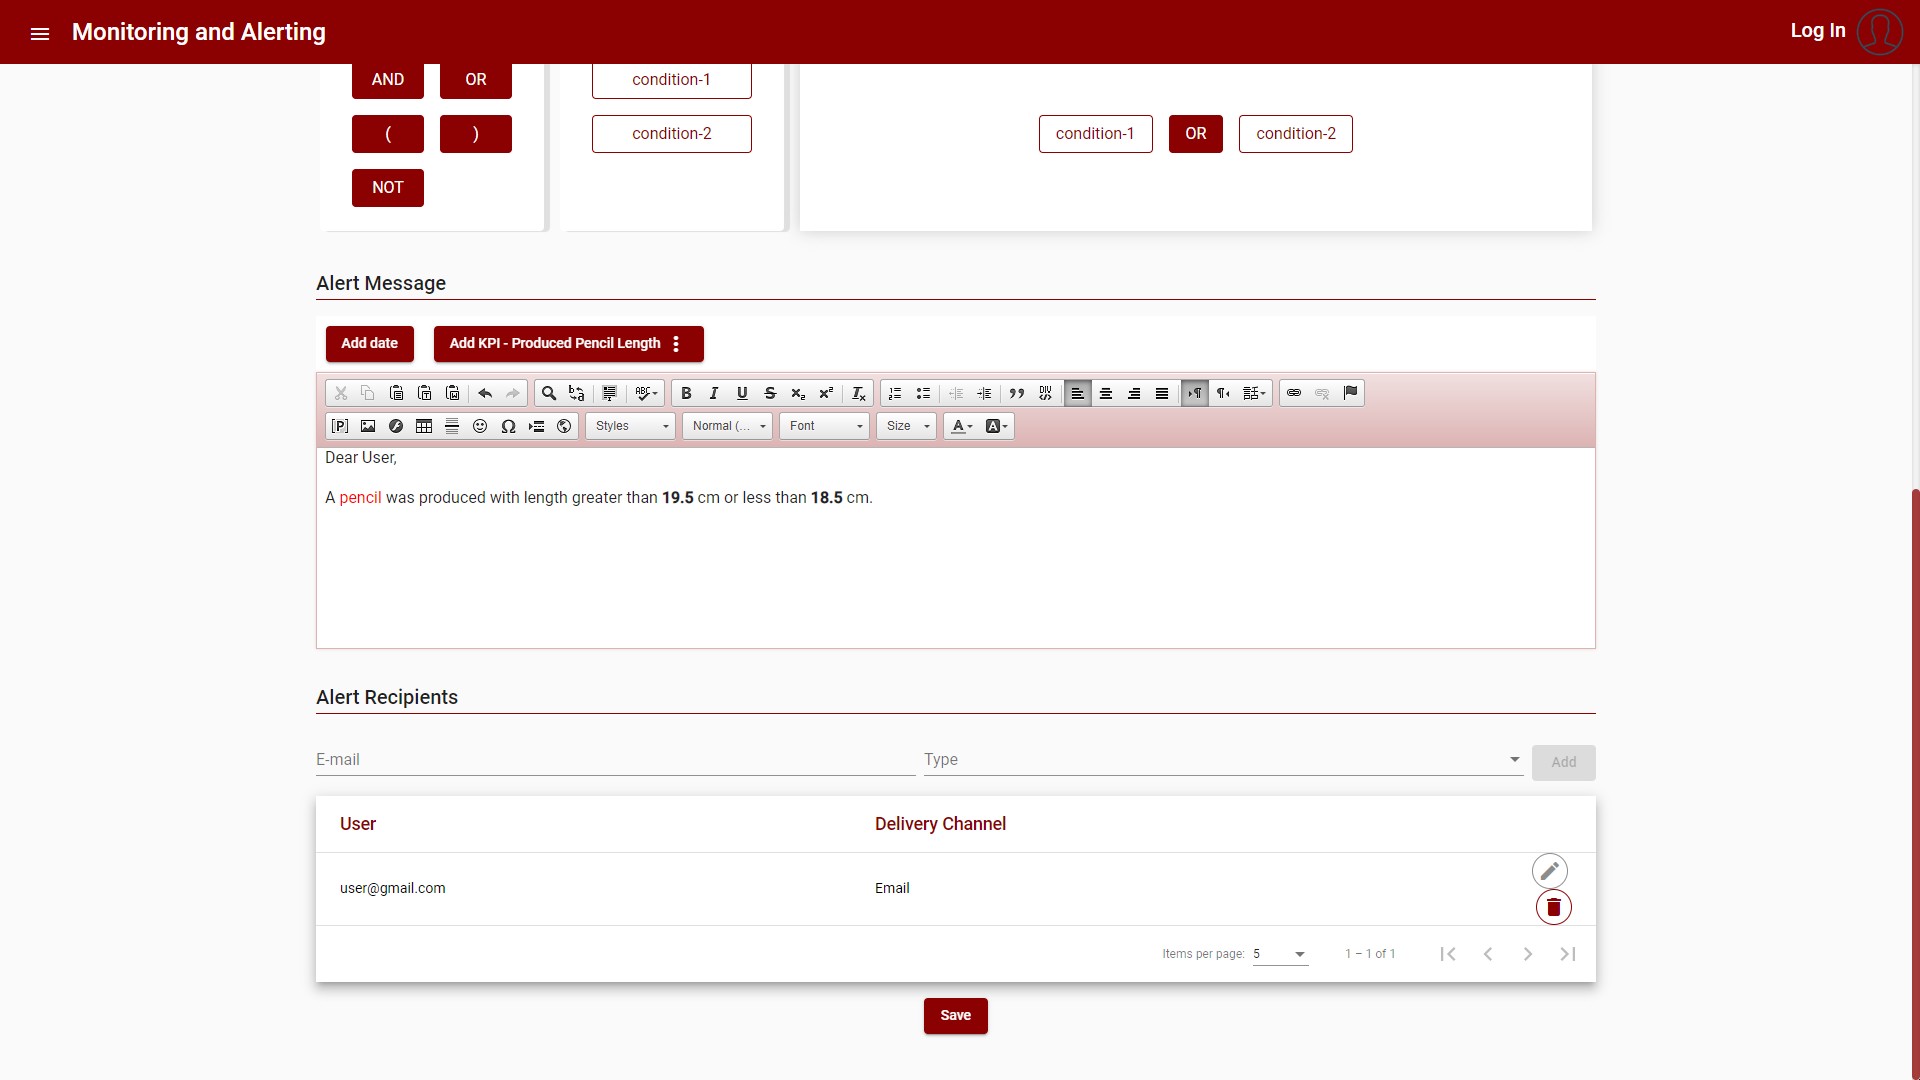
Figure 24 – Create new Alert – Part 2
After the Alert is created, the item appears in the Alert List View, and the conditions start to be monitored by the component:
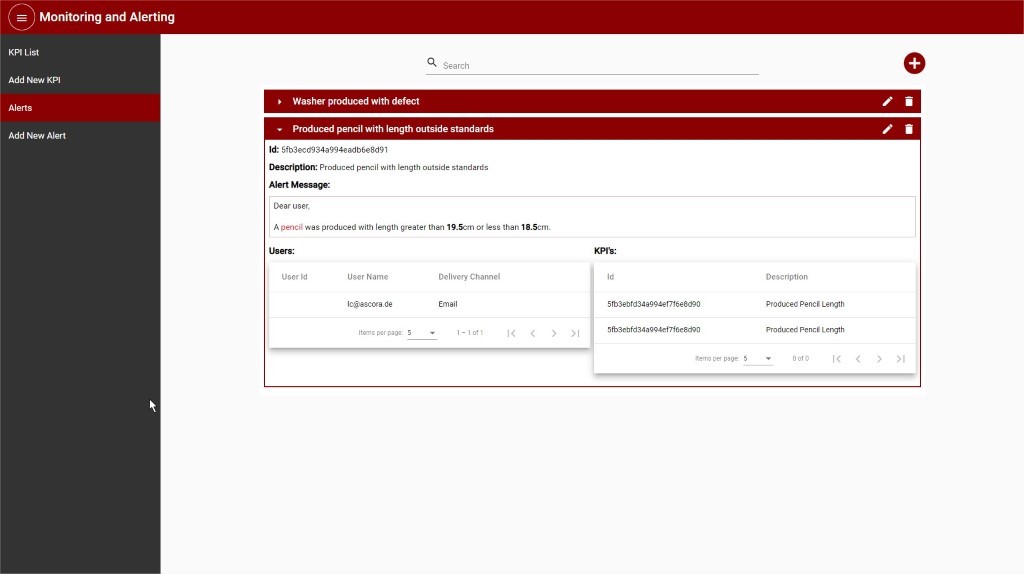
Figure 25 – Alert List View
When the conditions are matched, an e-mail is sent to the users:
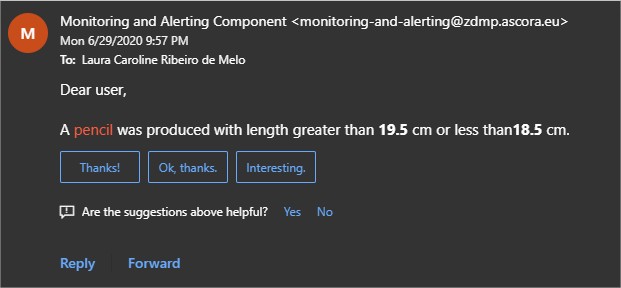
Figure 26 – E-mail sent by Alert
Push Gateway
The Push Gateway instance can be accessed at http://localhost:9091. The Push Gateway sends the KPI value update to the Prometheus instance, making it available also on Grafana.
Whenever a KPI value is updated, this value is sent to Prometheus, having the following information:
Job: kpiUpdate
Instance: [kpiId]
Labels:
kpiDescription: [kpiDescription]
kpiValue: [kpiValue] (this label is only present when the KPI value is not a numeric value)
Metrics:
kpi_value: [kpiValue] (when the KPI value is a numeric value)
kpi_value: [updateTime] (when the KPI value is not a numeric value)
Users can also use the Push Gateway to add additional values to be monitored by Prometheus. As a note, the push gateway only accepts numeric metrics, both integer and float are valid. More information about how to use the push gateway can be found in the official documentation and in this tutorial.
Follow an example of the Push gateway dashboard, where the KPI Pencil Production had an update where the value is 12.8:
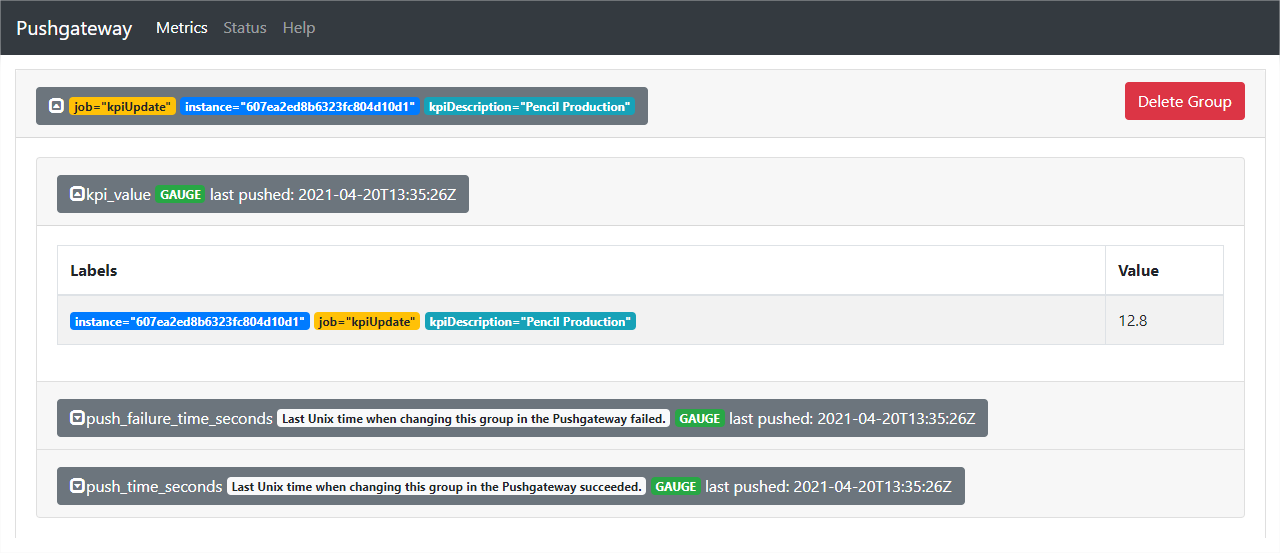
Figure 27 – Push gateway dashboard
Prometheus
The Prometheus instance can be accessed at http://localhost:9090. Prometheus receives data from the Push Gateway that can be used in the queries and alerts, the metric for the KPI updates is kpi_value.
More information about how to use Prometheus can be found in the official documentation.
Follow an example of the Prometheus query panel, with values sent by the Push gateway, where the KPI Pencil Production had an update where the value is 12.8:
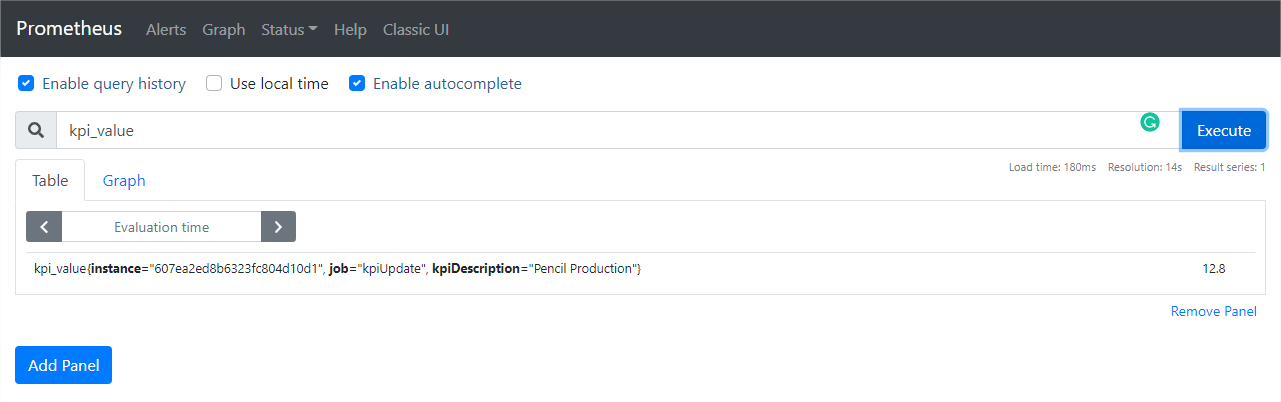
Figure 28 – Prometheus Query Panel
Grafana
The Grafana instance can be accessed at http://localhost:3000. Grana can compose observability dashboards, query, visualize, alert on, and explore the metrics received from Prometheus.
More information about how to use Grafana can be found in the official documentation.
Follow an example of the Grafana panel, with values collected from the Prometheus instance:
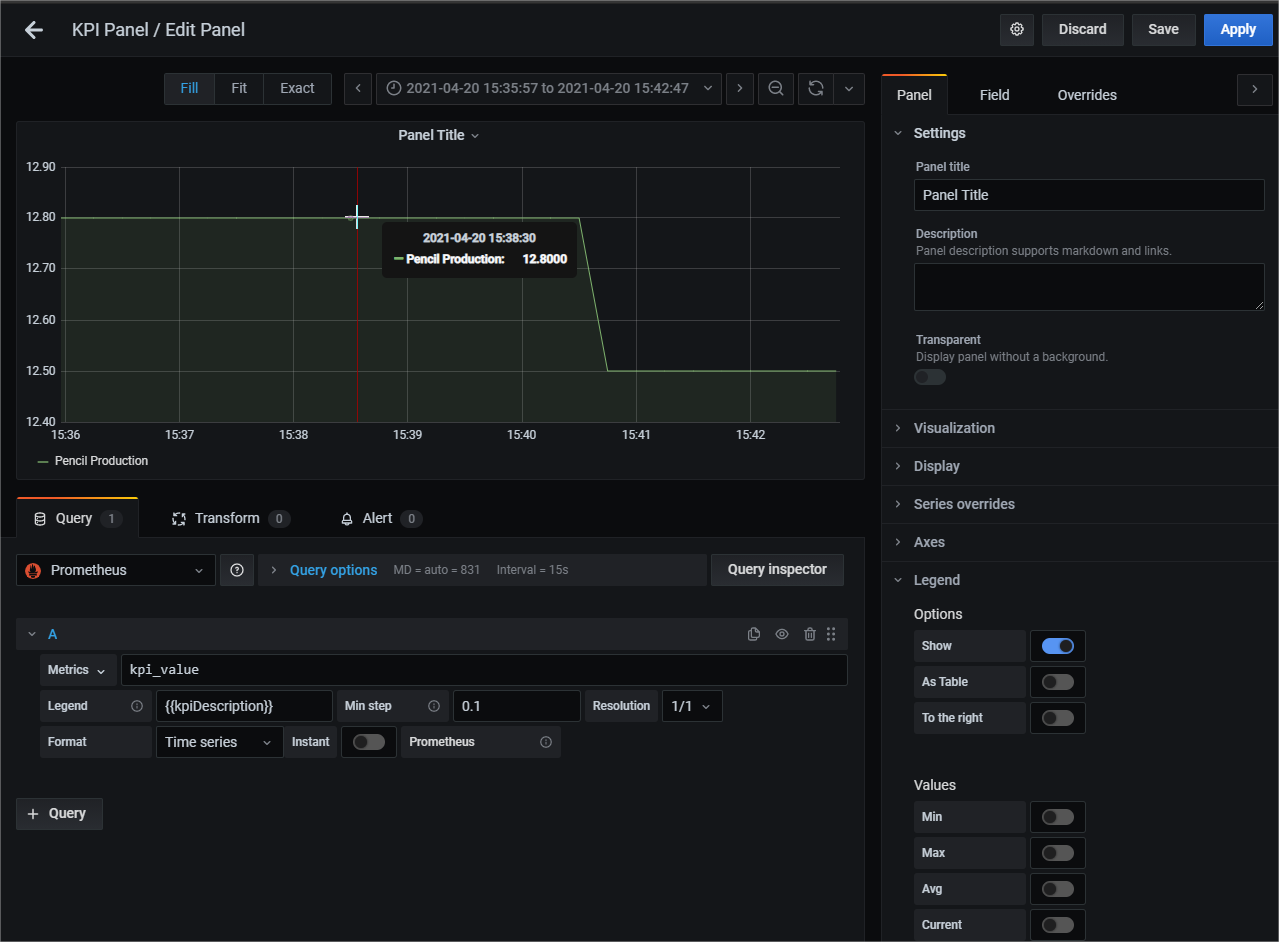
Figure 29 – Grafana Panel