Data Harmonisation Designer and Runtime

General Description
This component has access to raw data and ensures that data can be integrated using unified and standardised formats or the formats needed by the data recipient. It also provides basic functionalities for semantic homogenisation in a context of heterogeneous data meaning that the mapping is facilitated with reference to semantic through a ZDMP ontology.
The developed application enables a business analyst driven approach for the automatic linking of organisations’ data and meta data to the reference data model.
These data Maps are available in the ZDMP Data Storage and deployed and encapsulated as services to be finally exposed as software mini-packages, ie Docker containers. These mini-packages, containing the transformation routines, are uploaded, and published in the Marketplace to advertise and commercialise them.
One of their uses is, for example, as part of the execution of a process model in which they are rendered as services that can be called.
| Resource | Location |
|---|---|
| Source Code | Link |
| Latest Release | Vs 1.0.0 |
| X Open API Spec | Link |
| Video | Link |
| Further Guidance | Talend Tutorial |
| Related Datasets | None |
| Additional Links | Data Mapping - vf-OS Engagement Hub |
| Generation date of this content | 29 October 2021 |
Screenshots
The following images are illustrative screen shots of the component
Component Author(s)
| Company Name | ZDMP Acronym | Website | Logo |
|---|---|---|---|
| Information Catalyst for Enterprise | ICE | www.informationcatalyst.com |  |
| Instituto Desenvolvimento de Novas Tecnologias | UNIN | www.uninova.pt |  |
Commercial Information
| Resource | Location |
|---|---|
| IPR Link | |
| Price | [For determination at end of project] |
| Licence | [For determination at end of project] |
| Privacy Policy | [For determination at end of project] |
| Volume license | [For determination at end of project] |
Architecture Diagram
The following diagram shows the position of this component in the ZDMP architecture
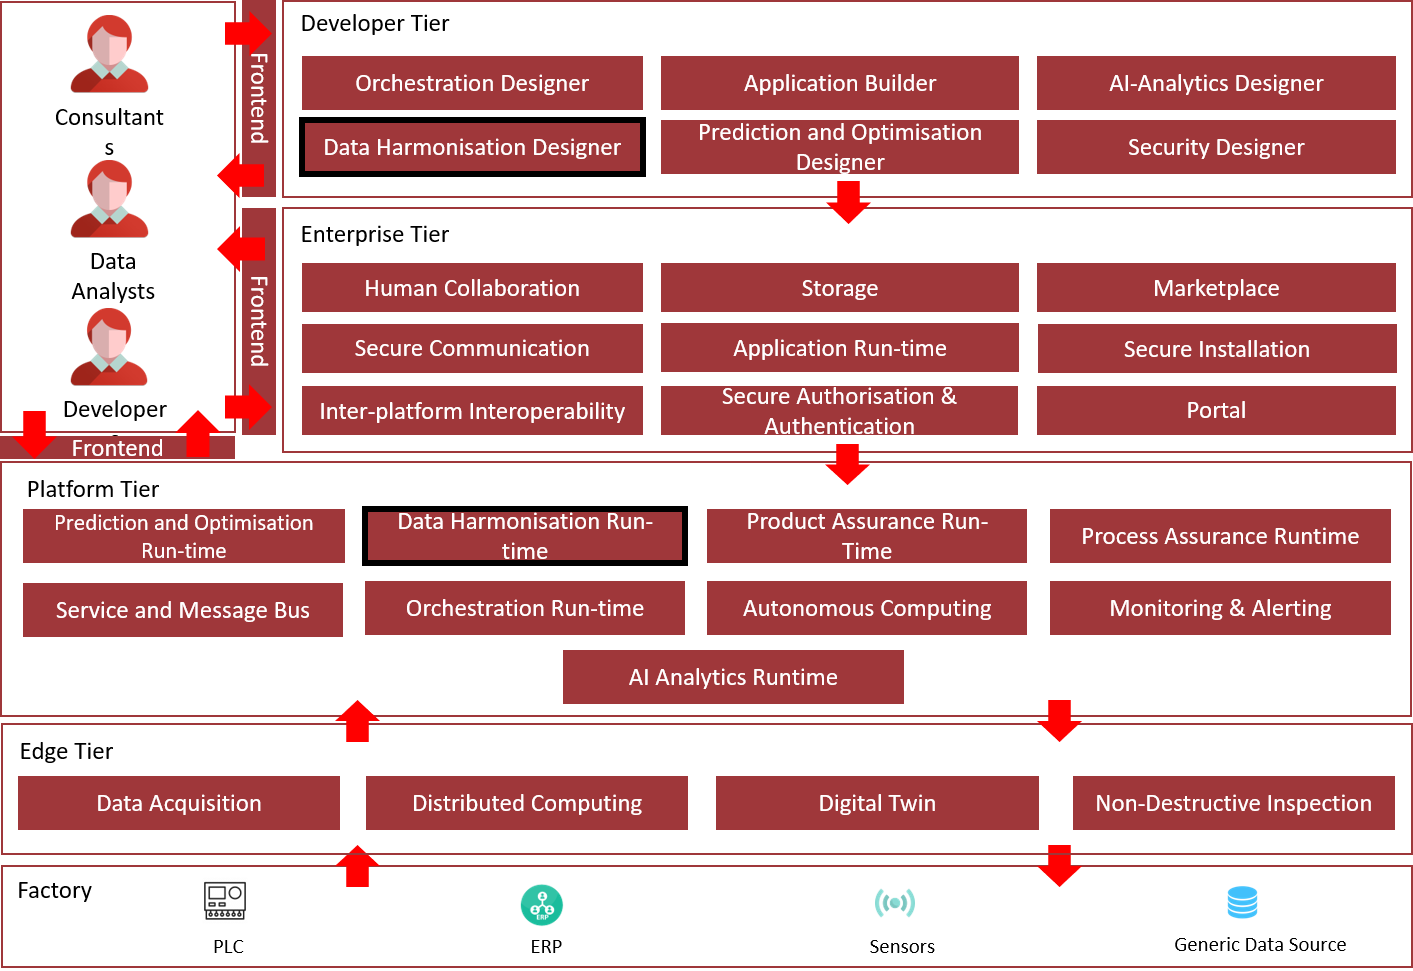
Figure 1: Position of Component in ZDMP Architecture
Benefits
Design, execute, and manage data transformations (maps): Enabling a reduction in operational costs and increased understanding of the data
Extract hidden value from data with semantic functionalities populated from known ontologies and updated using previous history
Streamlining the end-to-end supply chain enabling all different sources of data of the chain to be integrated into a single source of truth
Publish maps as services to be used by partners in their business processes
Function as a wisdom provider by sharing feedback about the semantic suggestions in the form of crowdsourcing
Features
This component offers the following features:
Maps Designer
Semantic Reasoner
Ontology Storage
Data Map Parser
Data Enrichment and Feature Extraction API
Map Designer UI
Publish Map API
Load and Save API
Schema Analyser API
Kubernetes Runtime
Streaming Support
Multi-tenancy
Runtime File I/O Management
Maps Designer
The Maps Designer module allows a person to generate Manufacturing Maps. A Manufacturing Map file describes the rules to be executed to transform a specific syntax format A into format B which could then, for example, be used as part of a process.
This map is a java archive file (with the .jar extension) wrapped in a docker container for execution. This container executes as a transformation engine.
It offers the developer the possibility to annotate these maps with additional descriptions.
This description eases the search and selection of the appropriate mapping rules. Manufacturing Maps can be stored in T6.2 Storage and may also be sent to the T6.2 Marketplace to use them as a service in T5.4 Orchestration Designer / Run-time, or via API requests from the T6.4 Service and Message Bus.
The Maps Designer is based on Talend Open Studio for Data Integration.
It provides a UI where users can build Data Pipelines, ie maps, in a graphical way in the form of drag-and-drop components.
Those components are the building blocks for the Data Pipeline, that in a basic form, would contain a data input component, a transformation component, and a data output component.
The Maps Designer is currently packaged with a suite of connectors like databases, files, object storage, big data filesystems, etc and also different transformation components that allow users to harmonise data.
In this sense, the data map parser, see Section 1.7.4, is the transformation component responsible to connect to the semantic reasoner and manage the recommendations.
Semantic Reasoner
Provides the user with helpful suggestions when performing mappings between distinct concept knowledge bases. The component relies on user input to improve suggestion quality, as it incorporates the effective mappings elected by users into a growing internal knowledge base.
It supports mapping restrictions for specific subsets of source and target mappings and provides data versatility by supporting different conceptual types of knowledge base transparently – triples, graph, ontology, or tabular.
The semantic reasoner can be bootstrapped through the injection of ontologies to provide a better out of the box experience.
Ontology Storage
Enables persistent data storage in support of the Semantic Reasoner. It stores the relevant ontology knowledge bases in graph form as well as the overarching ZDMP ontology.
The ZDMP ontology contains ZDMP specific vocabulary and ontology alignment.
Data Map Parser
It is the interoperability layer between the Semantic Reasoner core functionality and the Map Designer. It transforms generic requests into Semantic Reasoner queries.
This is the transformation Talend component with the ability to connect to the Semantic Reasoner and send and retrieve data in the form of semantic recommendations to aid in the mapping of the schemas.
It connects to the reasoner and retrieves semantic recommendations for a specific schema. Then in the specific UI developed for the component users can visually see the recommendations and how they match between different schemas.
Data Enrichment and Feature Extraction API
Derives attributes and features from the data. Use statistical properties, data models, and temporal data characteristics to discover internal relationships within the data.
This feature allows, via the different multiple transformation components it provides, to easily apply transformations to incoming data.
Map Designer UI
This UI is based upon the current ICE Data Platform (IDP). Developers can access the various Mapping features in a friendly way, e.g., generate Manufacturing Maps or annotate them with keywords and metadata.
It also allows the connection with the Data Service components to retrieve Data from querying the data model, ie the ontology.
Data Map Parser UI
There is a dedicated UI for the data map parser which displays the semantic recommendations and allows user to visually design the mappings between schemas from recommendations provided by the Data Map Parser through the Semantic Reasoner.
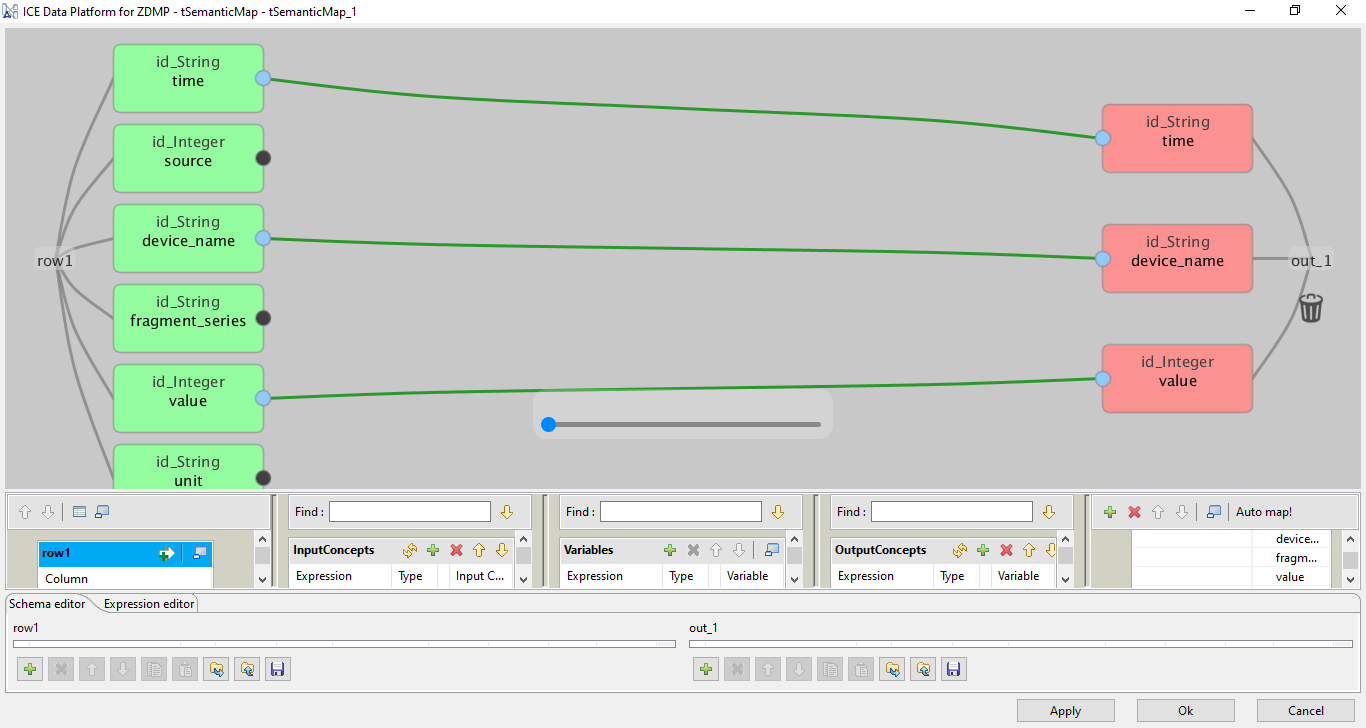
Figure 2: Semantic Map Design Example
Publish Map API
This interface encapsulates the access to the T6.2 Marketplace, where the deployed Maps are stored for re-use to sell and share.
The maps may also be published to T6.1 Application Builder for integration into zApps and directly to the T5.3 Data Harmonisation Run-time.
In addition, with the new Runtime able to install and run the maps, the idea is to provide a direct connection between the Map Designer and the Runtime, so that maps can directly be installed / deployed and run in the Runtime from the Designer.
Load and Save API
This interface encapsulates the access to the Storage, where data from this component is stored.
Schema Data Analyser
This interface manages the actual access to the external data sources and the objects where the data is generated and/or stored.
These formats can range from a text-file to a database schema passing by a CSV-type file or an XML and JSON type.
This helps to facilitate inter-platform interoperability by taking example data and meta-data from external platforms.
This is provided by the many input / output connectors packaged in the component and support of the usage of such connectors by the Runtime.
Not all input / output connectors have been tested yet, but work is being performed to provide the list of supported connectors by the runtime and increase that progressively.
So far, file input connectors in different formats such as csv, excel, etc, database connectors for some specific databases such as MySQL, and streaming connectors to RabbitMQ are officially supported.
Kubernetes Runtime
The dedicated Kubernetes Data Harmonisation Runtime is where the maps are managed and run. This is an application that allows users to deploy and run the maps designed and built from the designer. These maps are run by the runtime controller as standalone Kubernetes Deployments.
The runtime provides a unified view for all the user maps installed and running and takes care of deploying/deleting and running/stopping the maps, managing, and monitoring. Some statistics are also provided. Two running modes are provided to run the maps: batch or streaming.
Those actions are performed either via the runtime API or using the runtime UI. Users are able to install/uninstall, run/stop, manage and monitor the running maps. In addition, the runtime takes care of input / output in case of using files for those maps where input / output file components are used. For other input / output components, such as database input components, the input / output components used during design time provide that functionality.
The Runtime is mainly split in two separate microservices:
Runtime Controller: The main component responsible to register the maps and communicate with the Kubernetes API
Runtime Map Runner: The component responsible to unpackage the map zip file and run its contents when requested. This component is run per map, thus having as many running Map Runners as maps are deployed to the Runtime Controller. The Runtime Controller requests Kubernetes to run this component with the map file received during installation
In terms of functionality, users design a map via the Designer UI with an input component, a transformation component, which could be the semantic mapping component or other transformation components, and then an output component.
Then the Designer UI is used to build/package the Map or Data Pipeline as a zip file that contains a standalone java program that runs that specific map.
Then users install / deploy that zip file in the Runtime via the Runtime UI or the API. This registers the map in the Runtime, and requests Kubernetes to start the transformation.
Finally, users can run the maps via the Runtime UI or the Runtime API. The Runtime runs such maps as Kubernetes standalone deployments with the added benefit of leveraging Kubernetes container orchestration capabilities to manage the map lifecycle.
So as a summary, to run a semantic map:
Design Map via the Designer UI: Drag and drop the different components and map the different schemas via the Data Map Parser UI
Build the Map through the Designer UI: creates a zip file with standalone java software that runs the map
Install the Map in the Runtime: use the Runtime UI or API. The controller registers the map with a unique ID that the user provides as input and then requests Kubernetes to run the MapRunner with the provided map
Run the Map: Installing the map basically puts the MapRunner to run as a Kubernetes deployment but the actual map is not being run. To do so, the controller is requested to run the map with specific input / output data for that run. For streaming components, maps can be optionally set to run during installation time.
Streaming Support
The Runtime has been designed to support streaming maps / data pipelines. The controller treats those maps as regular maps. The MapRunner differentiates between batch and streaming maps. If a map is streaming, then it may be run during installation time.
In addition, to further support streaming, some custom Talend streaming input / output components, to connect to the bus are provided. For streaming, data is written into a bus topic, then, using the input component, the map loads the data, performs the transformation, and writes the data back to another topic. A combination of input / output components is supported for maps, such as reading from Bus or writing to a Database.
Specifically, RabbitMQ pub/sub components are provided to support streaming maps / data pipelines using the ZDMP message bus.
In terms of Runtime support, these maps are similar to the regular file input-based maps, but with the difference that they could be set to run non-stop. Contrary to batch runs, where users provide a batch of input data and retrieve the output data once, streaming maps may be kept running in a continuous real-time fashion, reading/writing from/to specific topics and reading/writing to the designed input/output source. RabbitMQ based maps can also be run in a batch fashion, reading/writing bulk data from a specific topic(s).
Figure 3 shows and example of a Map / DataPipeline using RabbitMQ pub/sub components:
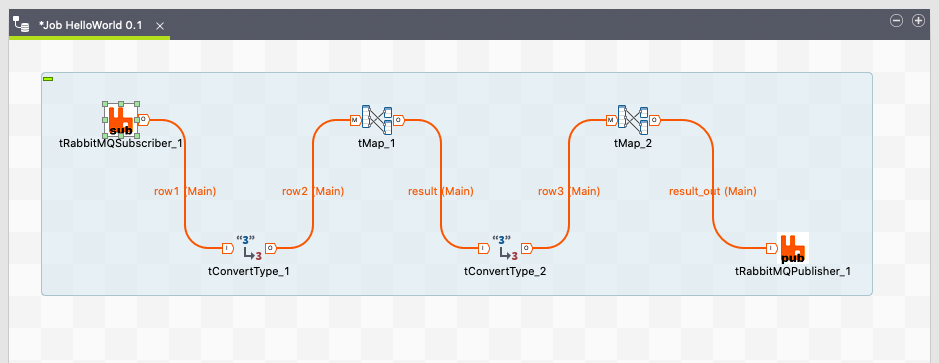
Figure 3: Example Map using RabbitMQ components
Multi-Tenancy
The Kubernetes runtime has been designed as a multi-tenant component. That means that the application is able to manage data from several organisations using the same instance.
Multi-tenancy support has been designed to align with the ZDMP multi-tenancy which means the use of JWT tokens and integration with Keycloak and DashButton (Portal). The Runtime UI, using the integration with the DashButton, obtains the JWT token that contains the organisation and user data to for authentication/authorisation.
This JWT token is sent from the Controller UI to the Controller Backend, via the ZDMP APIGW. The Controller Backend parses the received JWT token, extracting the organisation id, user id and roles, allowing the validated user/organisations to access the corresponding information.
The APIGW component is used to validate and verify the token before being received by the Controller backend.
Figure 4 shows the new Runtime Controller UI being developed with the DashButton integration that allows user log in/out and retrieving the JWT token.
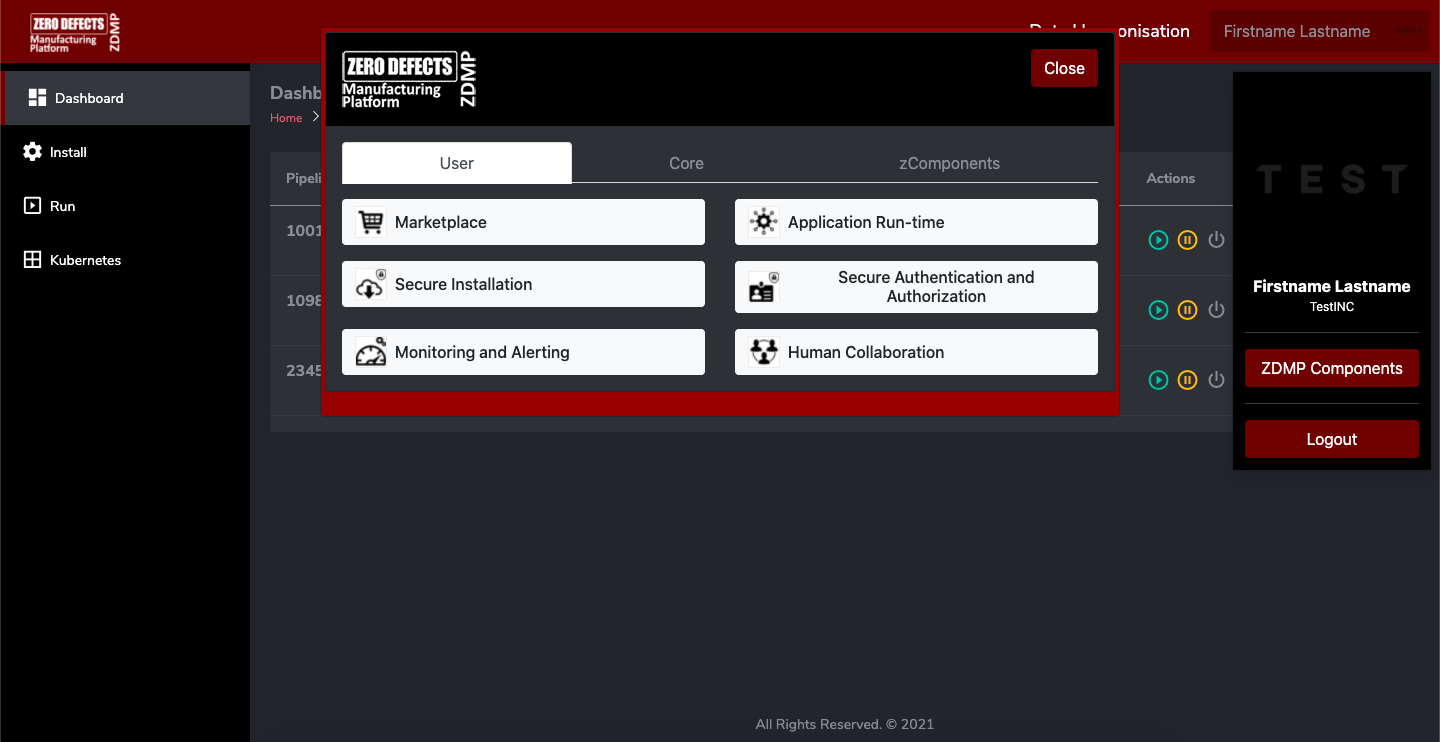
Figure 4: Runtime Controller UI with DashButton integration
Runtime File I/O Management
Input and Output data can be managed in two ways from the Runtime.
First, I/O can be managed by the designed map itself. That is, if input/output data is retrieved/sent from/to a database, the Runtime Controller just runs the map but does not perform or control any feature about such input/output.
For files, the user can choose to design pipelines with managed I/O, for instance using some Hadoop or MinIO components. That means input / output is also managed by the map.
Users could also decide to design a map with input/output component of type FileIn or FileOut. These components expect to read/write data to a specific path in the local filesystem. In this case, the Runtime Controller and the MapRunner take care of managing such input and output files.
For this, specific API endpoints are provided to upload (PUT) and retrieve (GET) input and output files as I/O for a map.
If a user runs one of those maps, it has to be performed in three steps:
Put the Input Data File: Controller gets the data file and shares it with the requested map
Run the map: Controller receives the request to run a map and sends the call to the specific MapRunner. The MapRunner run its corresponding map using the previous updated data file
Get the Output File: Controller retrieves the result data file from the corresponding MapRunner and sends it to the user
Installation
Data Harmonisation Designer
When opening the source link, it takes the user to the ZDMP Gitlab, specifically, the Data Harmonisation project. Inside the “harmonisation” folder, the user can see a ZIP file, with the name of “IDP-Installer-[release -details]-V7.2.1.zip”.
The ZIP file contains a stable version of the Data Harmonisation Designer. The numbers that make up the release details of this file in the ZIP file name may change in subsequent releases. As of M30, the ZIP file is called “IDP-Installer-20200611_0854-V7.2.1.zip” and is 998 MB in size.
When the user selects the ZIP file, the user is taken to a page where they can select “Download”.
When the user downloads this ZIP file, they can open it open this ZIP file, and they can extract it to a location on their system of the user’s choice.
When extracted, the user should have a folder with the same name as the ZIP file, and inside this folder they can find the files that make the Data Harmonisation component.
From here, the user has to run “TOS_DI-win-x86_64.exe” which runs the ICE Data Platform.
Semantic Reasoner
When opening the source link, it takes the user to the ZDMP Gitlab, specifically, the Data Harmonisation project. On the left tab, there is an option that is titled “Package & Registries”. If the user clicks on this tab, they are taken to the “Container Registry” page.
On this page, the user sees two docker images and they need to create a local version of the Semantic Reasoner.
When these images are built, the designer connects to the running docker containers automatically whenever the data harmonisation design time is run.
Data Harmonisation Runtime
The runtime component is deployed to Kubernetes using the helm charts created in conjunction with the Application Runtime, and from the ZDMP Marketplace.
System Requirements
Following are displayed the Design Component minimum requirements needed:
Docker
A desktop Linux, or Windows PC with these minimum resources:
2 CPUs
4 GB RAM
3 GB+ Disk Space
A way to extract ZIP files
The Runtime runs in the ZDMP platform but if a user wants to test it in a local environment these are the recommended minimum requirements:
Docker
A Kubernetes Cluster
Resources depend on the number of maps deployed but minimum
2 CPUs
2 GB RAM
1 GB+ Disk Space
Associated ZDMP services
Required
Optional
How to use
There are two sections, the first of which deals with the Data Harmonisation Design time, and the second, that details the use of the Data Harmonisation Runtime.
Data Harmonisation Design Time
This section shows how to use the Data Harmonisation Design Time, with the following sections:
Welcome Page
Creating a New Job
Creating Inputs and Outputs
Semantic Reasoner
Building the Job
The Welcome Page
When the user runs the file TOS_DI-winx86_64.exe, the ICE Data Platform opens. The user is prompted to either run an existing project or create a new project. After they name a new project, they are taken to the same screen as in the screenshot below.
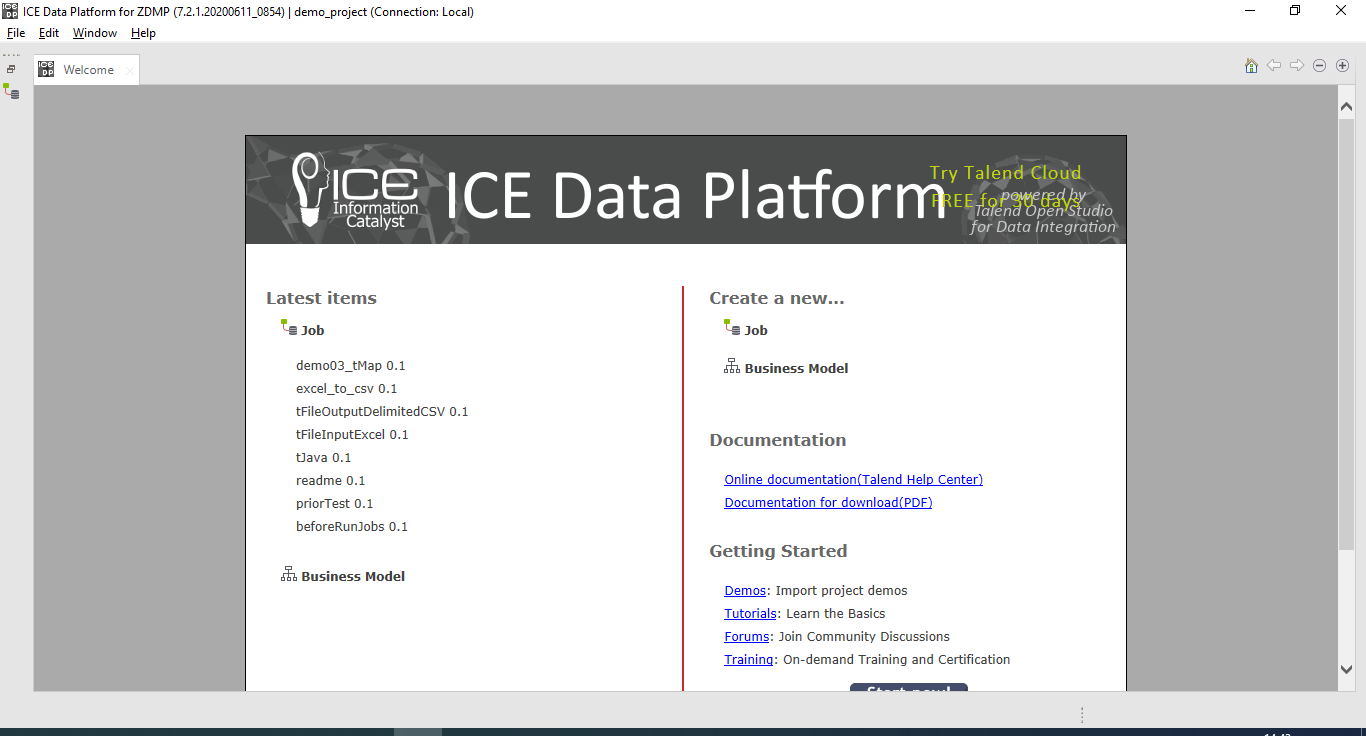
Figure 5: Screenshot of the Ice Data Platform Welcome Page
From here, the user can open a job they have previously worked on, or they can create a new job. They can also be directed towards various tutorials where they can learn more about the intricacies of the ICE Data Platform or view more documentation.
Creating a New Job
When the user chooses to create a job, they are greeted with a popup box that requires the user to make entries. Whilst the Name field is required, there are warnings about leaving the Purpose and Description fields blank. The user cannot continue until they enter a name, but the other details can be changed through the properties menu.
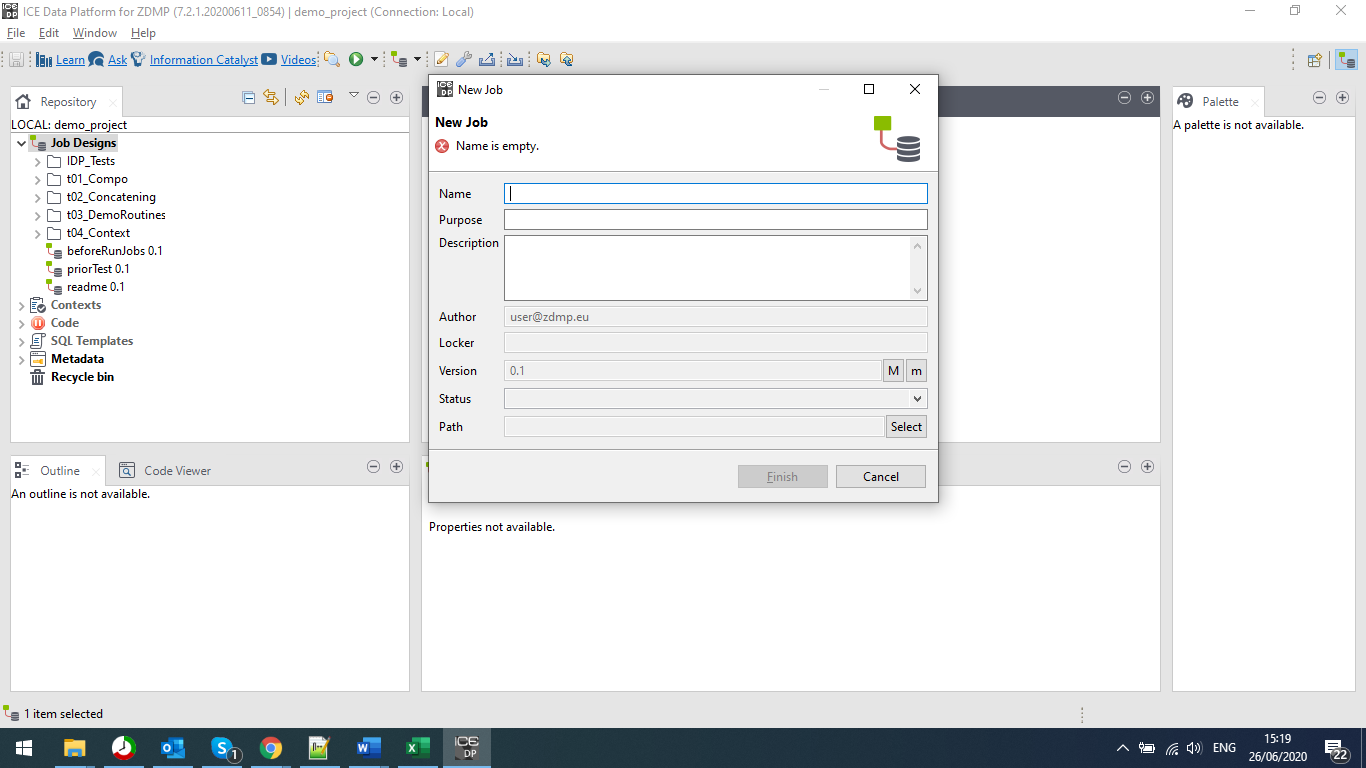
Figure 6: A Screenshot Showing the New Job Pop-up Box
When the user does select the finish button, the pop-up box disappears, and the user views the main canvas of the ICE Data Platform. On the left side of the screen, they can see the list of jobs, as well as the code base that makes up the different jobs. On the right, they can see the palette of tasks that they can use. In Figure 6, the palette has not loaded, and this process can take a few seconds before it becomes populated with elements.
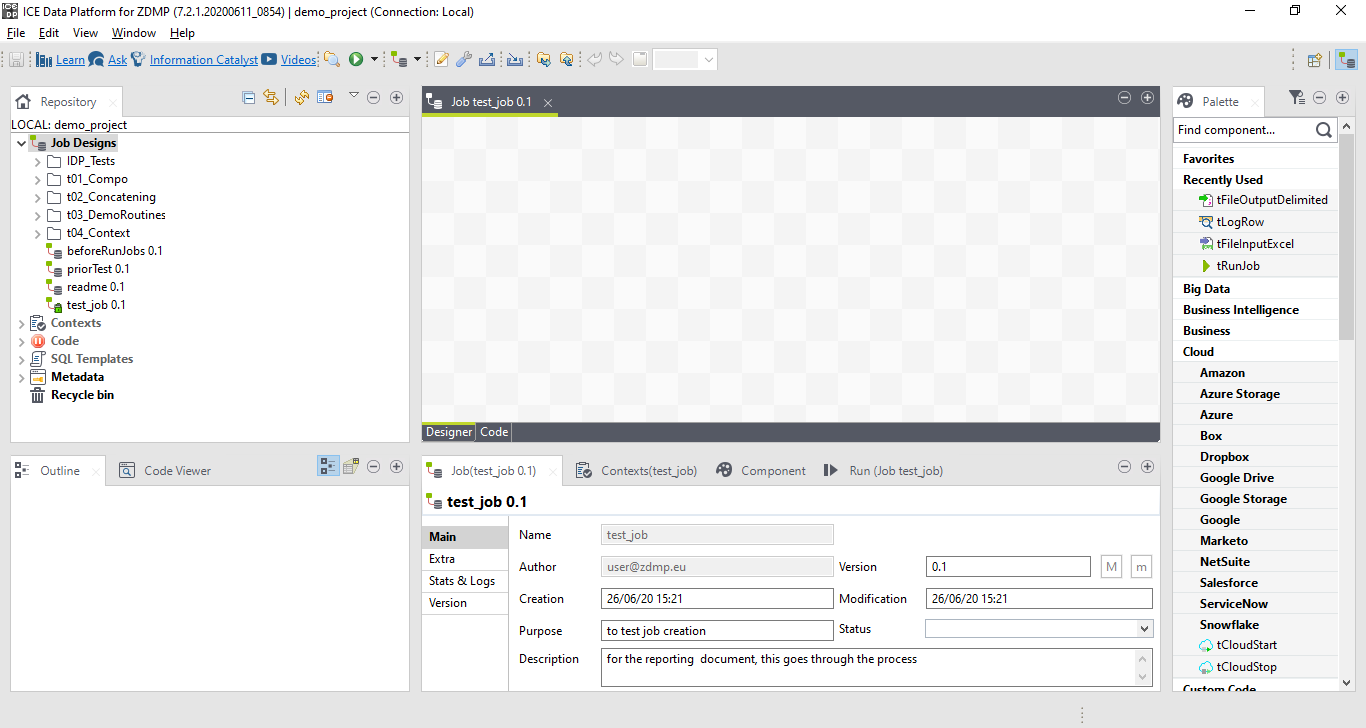
Figure 7: A Screenshot of the Ice Data Platform with a Populated Palette
Creating Inputs and Outputs
From the open version of the ICE Data Platform, users can click and drag elements from the palette into the canvas to create jobs. Eventually, these jobs can be exported to become executable services.
From the Palette, the user can search for specific tasks, such as importing an Excel file (tFileInputExcel), exporting to a text file (tFileOutputDelimited) or use the Semantic Reasoner (tSemanticMap).
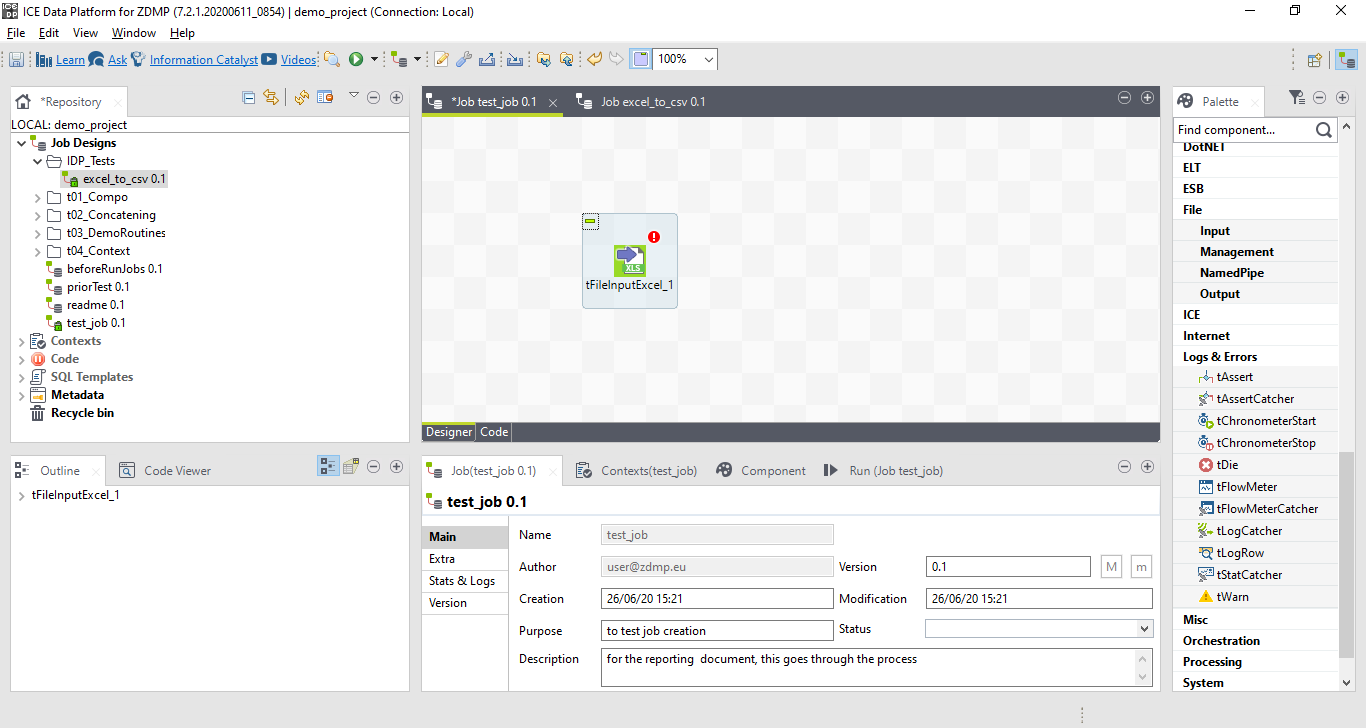
Figure 8: A Screenshot Showing the User Using the Canvas
As shown in Figure 8, the tFileInputExcel_1 task has a red exclamation symbol on it. This shows the user that they have actions to do on the task. For this task specifically, it is defining the schema of the input, and whilst this is for an Excel input, the process is similar for most inputs.
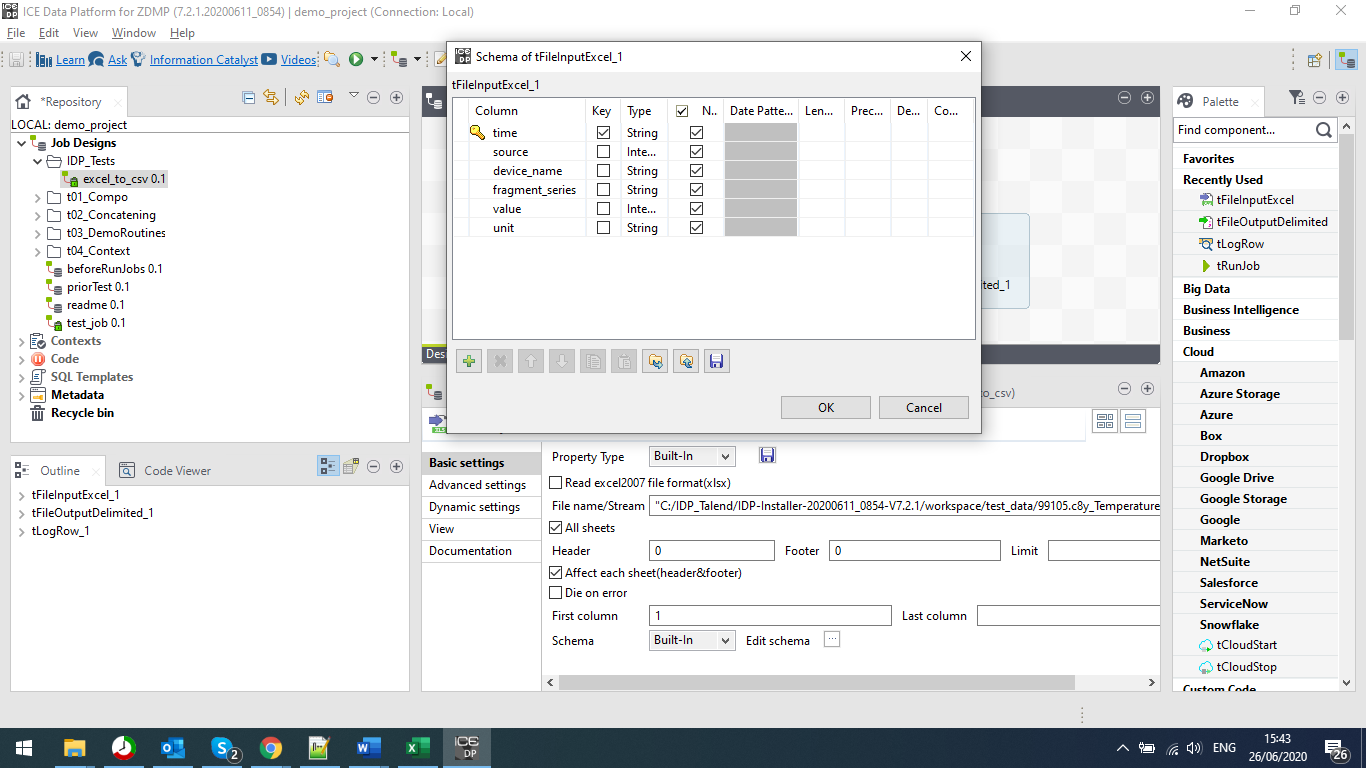
Figure 9: A Screenshot showing the File Input Properties
As shown in Figure 9, the user is required to define the files that they want the ICE Data Platform to use. This process is the same for both input and output processes. The user defines what they are putting into the process, and they define what they expect to get out of it.
Semantic Reasoner
The functionality that the ICE Data Platform includes the ability to transform files between formats. The way that it does this is by using the Semantic Reasoner component, or in the palette, the tSemanticMap task.
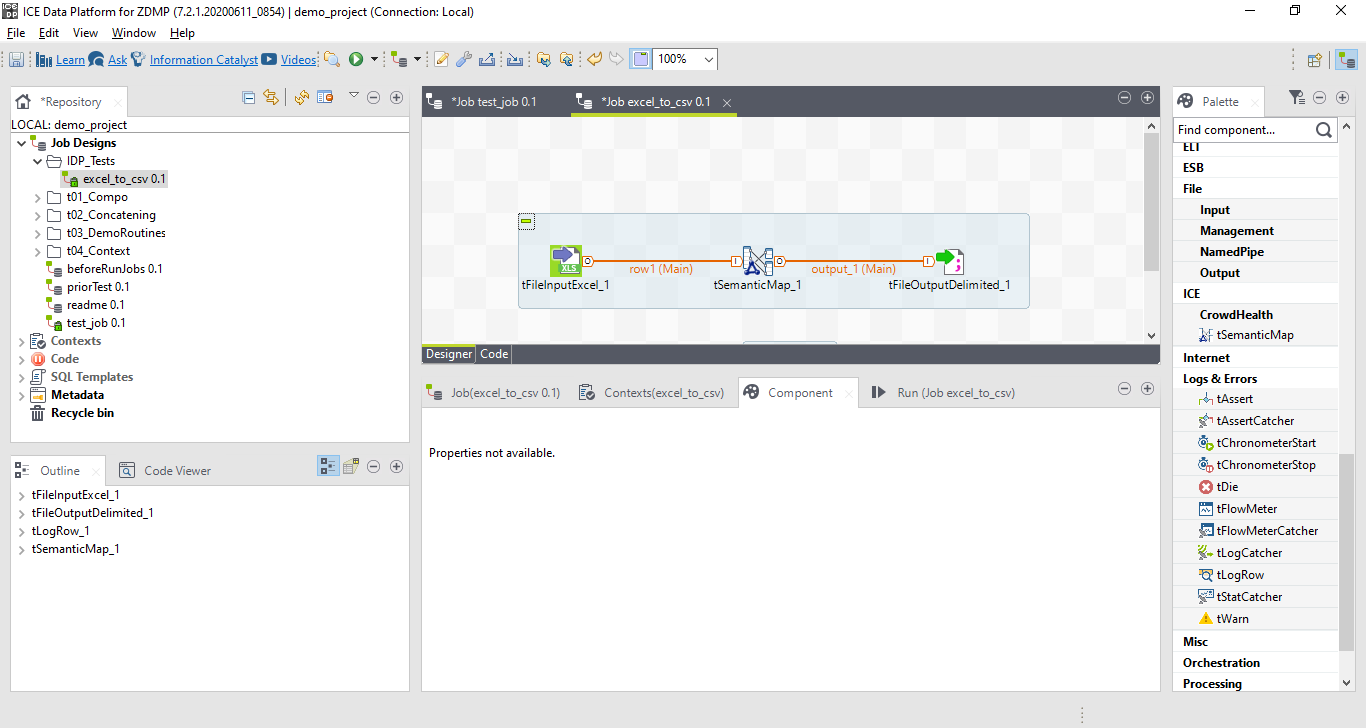
Figure 10: A Screenshot of the Ice Data Platform Canvas using the Semantic Reasoner
By double clicking on the tSemanticMap_1, they are taken to the Semantic Reasoner interface.
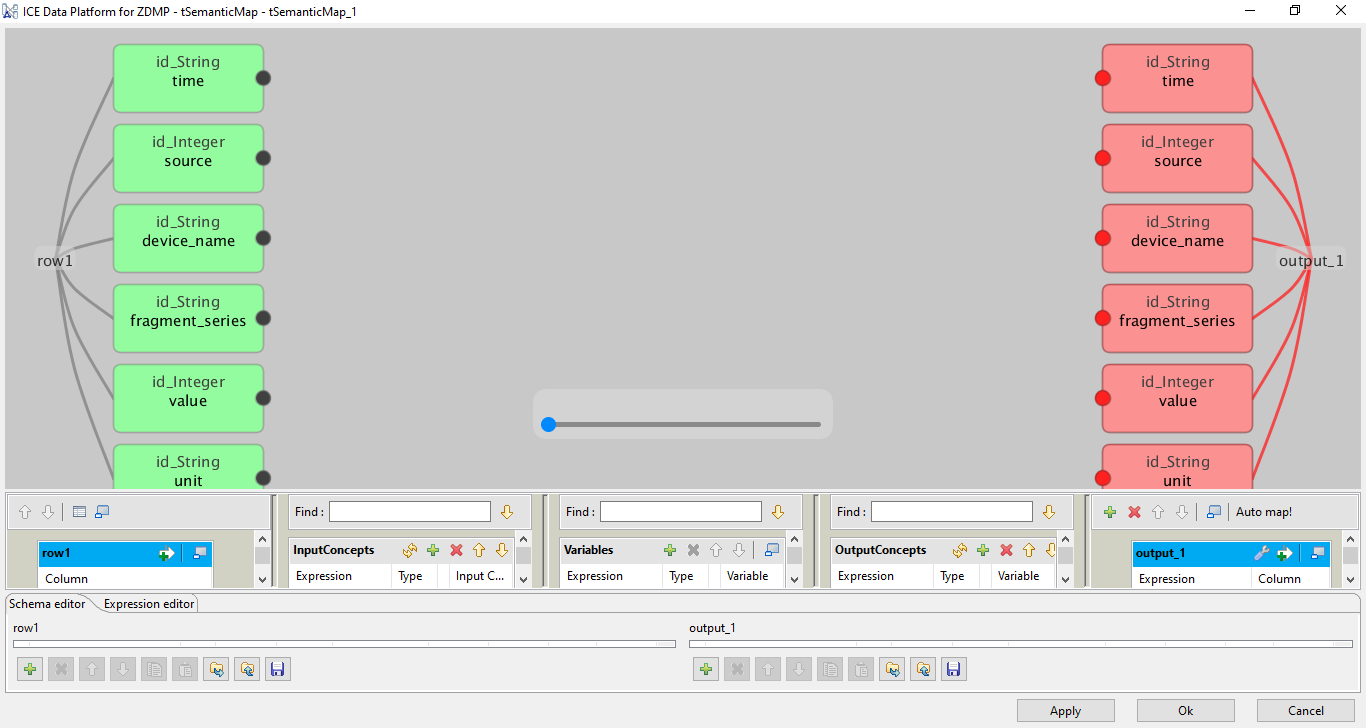
Figure 11: The Ice Data Platform Semantic Reasoner Interface
From this screen, the user can see the schema of both input and outputs to the semantic mapping task. As in Figure 11, the bottom right, there is the “Auto map!” which uses the Semantic Reasoner component to make the best guesses at which of the input data to match to the same or similar output data.
Figure 12: The Semantic Reasoner Mapping to a Smaller Output
The user can also make modifications, and this causes data to be sent back to the Semantic Reasoner to help improve the semantic mapping in the future.
When they select the apply button, these changes are applied, and when they click the OK button, they are taken back to the canvas.
Building the Job
When the user has created a job, they can build the job into an executable process. This process can be used in conjunction with other executable processes and services.
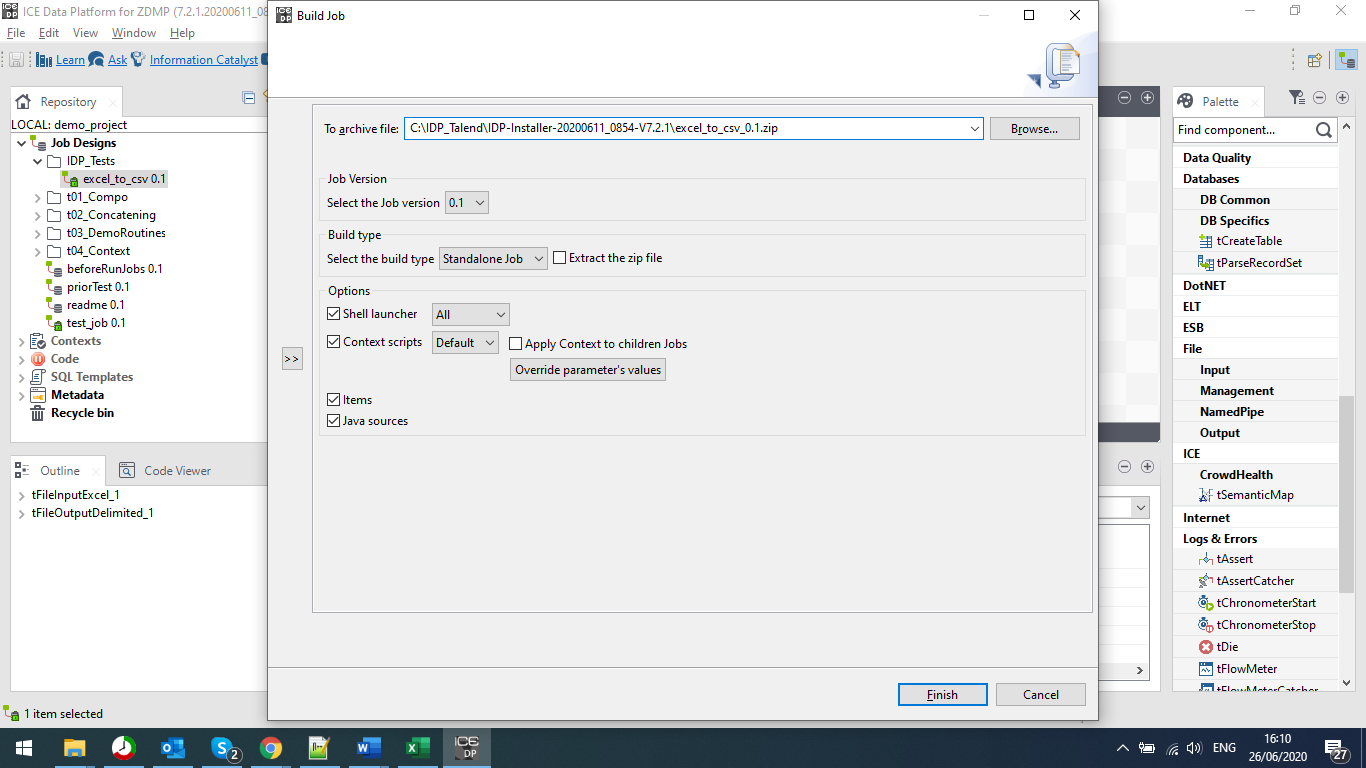
Figure 13: A Screenshot of the Build Job Pop-up Box
As shown in Figure 13, the user is given various options. From where to save built job, to more specific options, such as different shell options. One of the more important options, is the Build Type selection, where the user can get choose the build type, choosing between a standalone job, or a ZDMP Docker instance.
This Docker instance can be used by any of the components that use Docker, and if they do not, or the user does not use the Docker instances, they can choose the standalone executable.
Data Harmonisation Runtime
Along with the Data Harmonisation Runtime, a web UI is deployed where users are able to perform the typical administration tasks. The user can perform the following operations via a provided API:
Install map: Registers a map in the Runtime and starts the MapRunner that is responsible to run that map as a Kubernetes deployment
Uninstall map: Deletes and unregisters the map from the Runtime deleting also the corresponding MapRunner Kubernetes deployment
Run map: Runs the map itself. That is, runs the built java software that has been installed in the installation step
Stop map: In case of a streaming map, running continuously, this can be used to stop such mapping
List maps: Retrieve a list of the installed maps and its status, ie Running, Stopped, Installed
Statistics: Retrieve some statistics about the installed maps, such as installation date, last run datetime, number of runs, data processed, Kubernetes resources being used, etc
So far, a development UI for testing and validation is being used. This UI is useful to test the designed maps in the ZDMP platform. A production-ready UI is currently being developed with similar usability to the one described in this section but with additional features.

Figure 14: A Screenshot of the Runtime UI
In order to install a map, navigate to Install, click on Choose File, and select the zip file corresponding to the map built from the designer to be installed. Assign a unique id and click on Install DataPipeline.
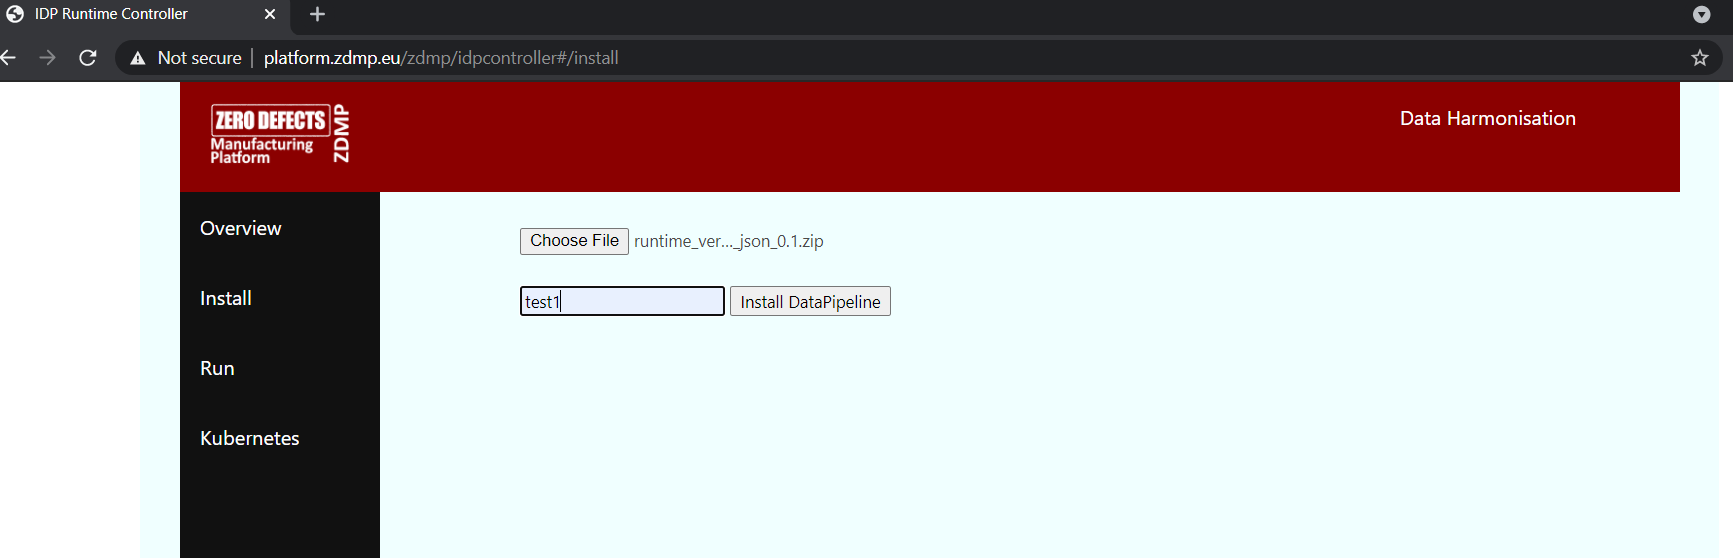
Figure 15: A Screenshot of the Runtime UI – Install a DataPipeline
Once the map has been installed, navigate to the Overview where the list of maps currently installed is displayed.
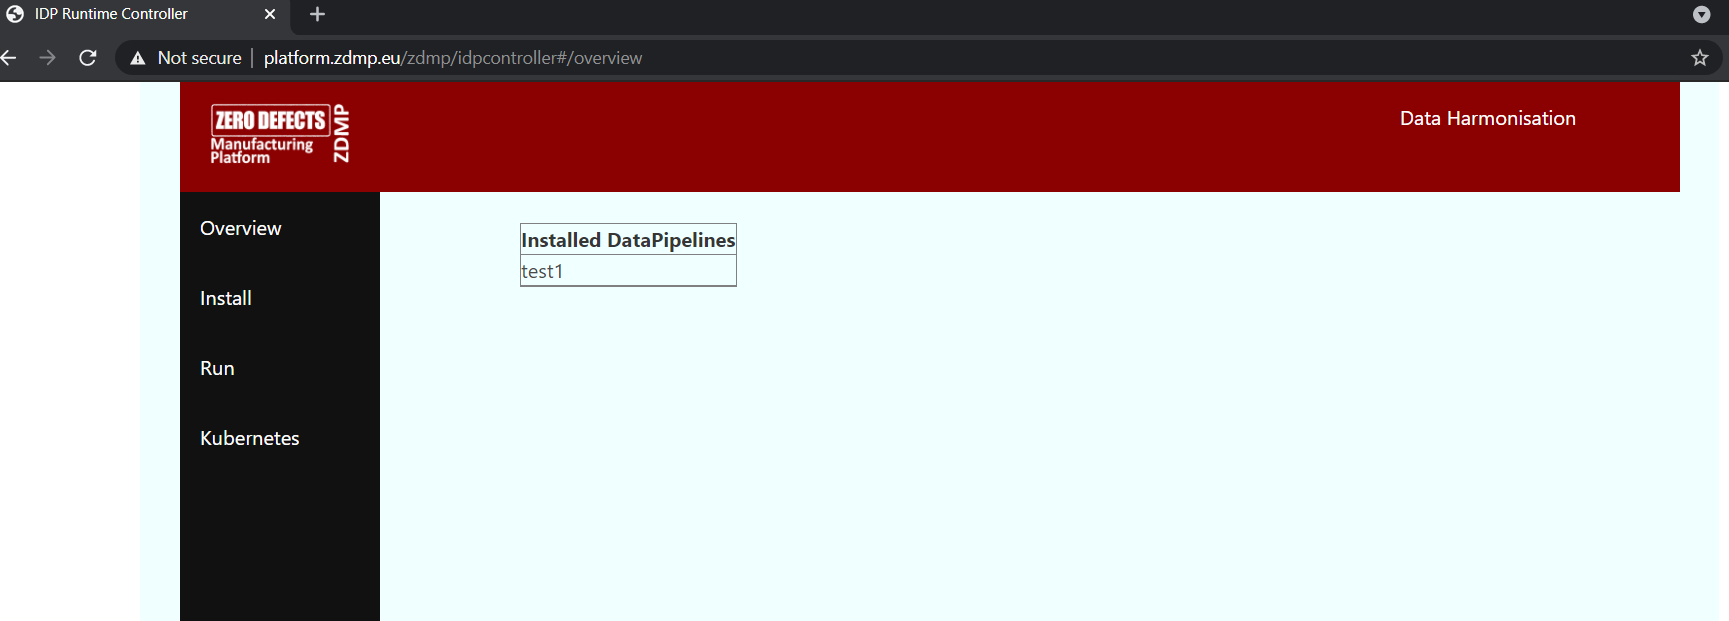
Figure 16: A Screenshot of the Runtime UI – Overview
The map is installed as it is displayed in the list.
Now the map has to be run. In the example a map transforming a CSV file to a JSON file has been installed. Since the installed map needs the runtime to manage the files I/O, the run is divided into three stages:
Put file: this sends the file containing the data to transform to the runtime
Run: this runs the map with the last input file that was sent (put)
Get file: this retrieves the output file from the last run
So, to put a file, click on Choose File to select the data file, indicate the ID of the map to send the data to and click Put File button.
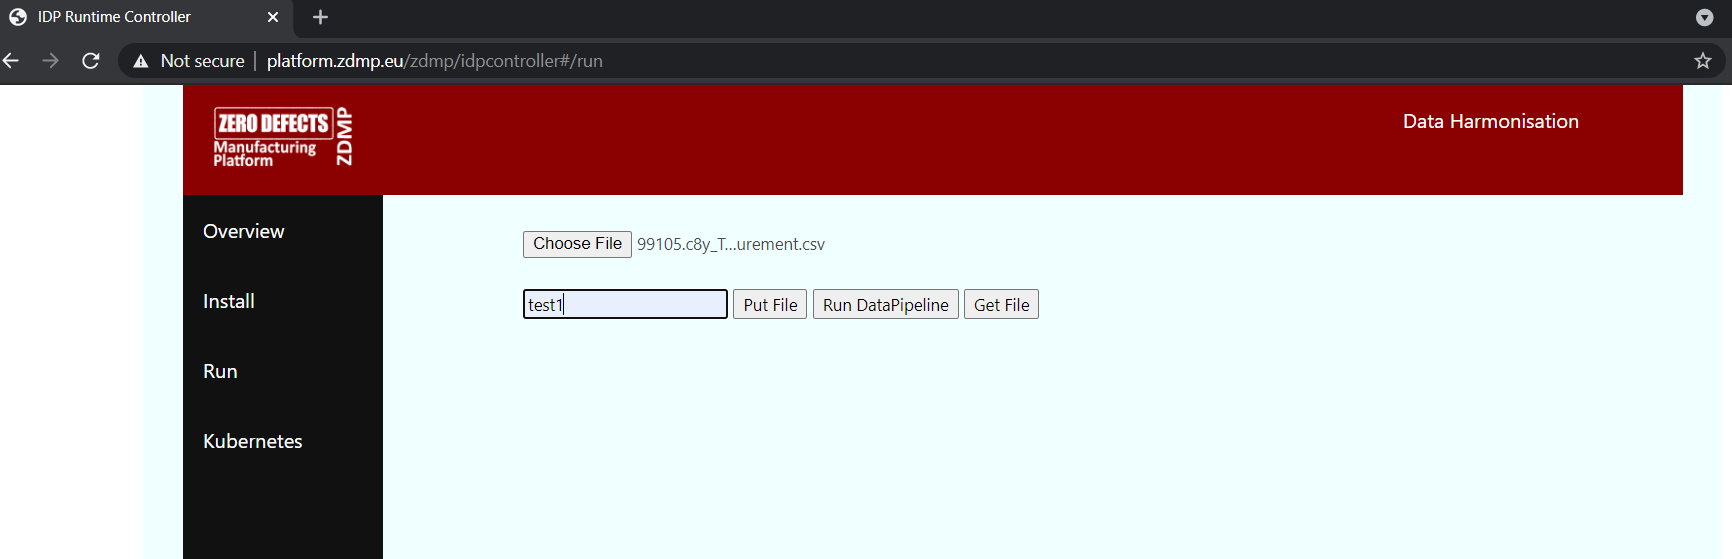
Figure 17: A Screenshot of the Runtime UI – Run a DataPipeline
Once the data has been sent, indicate the map ID to run (same one to which the data is sent) and click Run DataPipeline button. This applies the transformation and create the output data file in the map runtime.
To retrieve the data file, indicate the map id and click Get File button. This downloads the output data file that can then be saved.
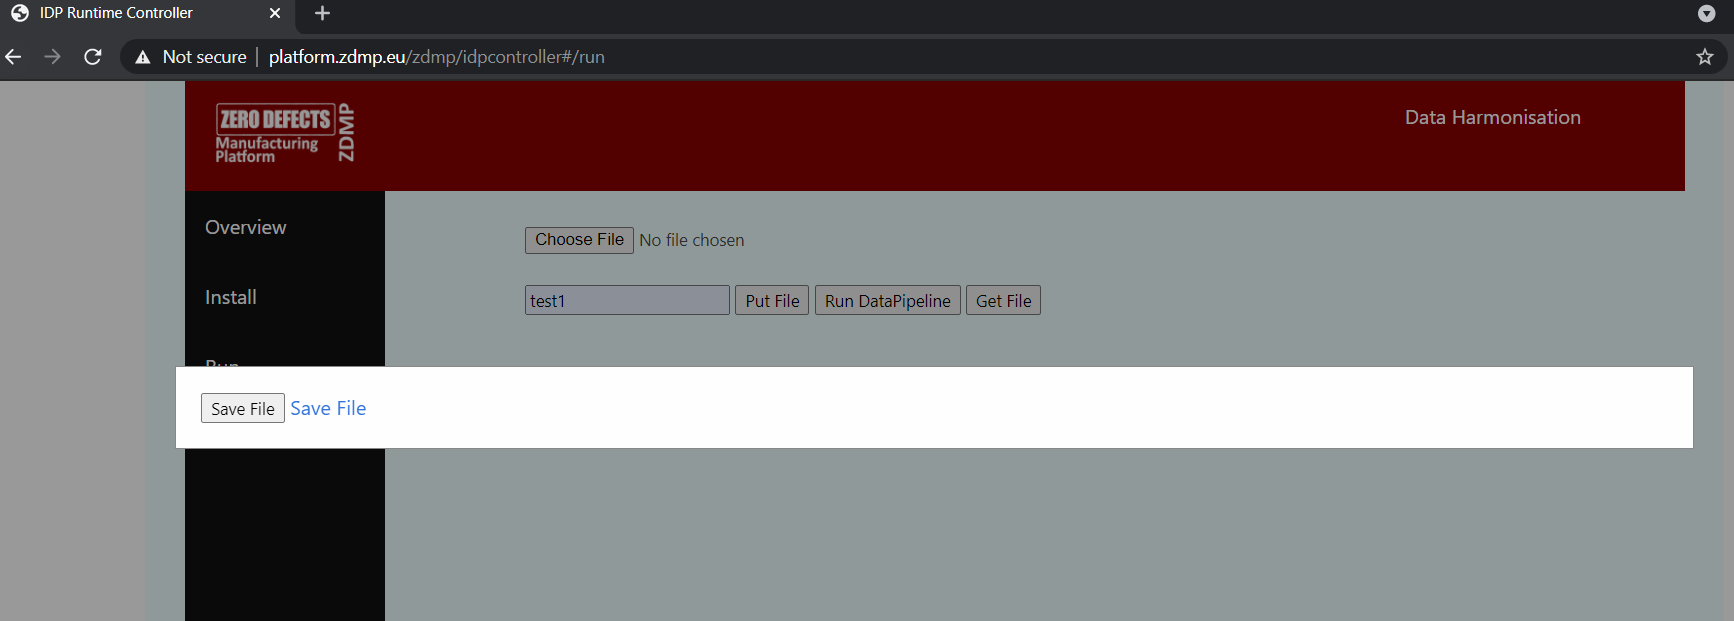
Figure 18: A Screenshot of the Runtime UI – Get File