Digital Twin
General Description
This is the readme of the Digital Twin. Digital twin refers to a digital replica of potential and actual physical assets (physical twin), containing processes and products that can be used for various purposes. With the digital twin is possible to represent and model processes and products features (ie physical characteristics, bill of materials, tolerances, etc). Moreover, it provides data objects describing various aspects of the physical and logical parts of a manufacturing process. Additionally, it also includes the status of the different (potentially distributed) components of the manufacturing system and product features. A digital twin allows to simulate the future state of the manufacturing process or product production using AI algorithms to perform a dynamic virtual representation.
| Resource | Location |
|---|---|
| Source Code | Link |
| Latest Release (v1.0.0) | Download |
| X Open API Spec | Link |
| Video | Link |
| Further Guidance |
|
| Related Datasets |
|
| Additional Links |
|
| Generation date of this content | 14 May 2021 |
Screenshots
The following images are illustrative screen shots of the component.
Figure 1. Digital Twin interface
Component Author
| Company Name | ZDMP Acronym | Website | Logo |
|---|---|---|---|
| Ceteck Tecnológica S.L. | CET | http://www.grupoceteck.com |  |
Commercial Information
| Resource | Location |
|---|---|
| IPR Link | CET Digital Twin |
| Price | [For determination at end of project] |
| Licence | [For determination at end of project] |
| Privacy Policy | [For determination at end of project] |
| Volume license | [For determination at end of project] |
Architecture Diagram
In Figure 2 diagram shows the position of this component in the ZDMP architecture.
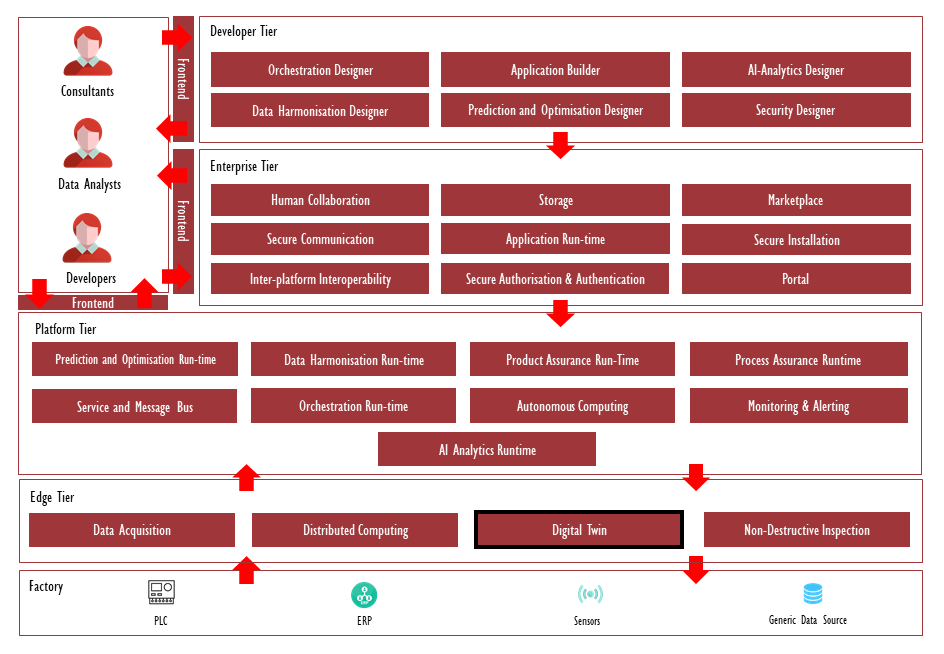
Figure 2. Position of Component in ZDMP Architecture
Benefits
Allows a digital representation of a process or product (a digital twin model). This digital representation can be used to represent something physical in detail and apply the information in practical ways
The elements included in the digital twin model are organized in a hierarchical way so that the user can navigate through the different nodes that make up the model and have all the information required quickly
The user creates and modifies a digital twin model in a straightforward way
The simulation and prediction tools allow the user to link AI Analytics Run-time (which integrates Prediction and Optimisation Run-time) algorithms and incorporate these results into the digital twin model
Features
Create and manage plant digital twin models, contextualizing assets, products, and processes with static attributes (characteristics) and dynamic attributes (real-time signals)
Hierarchical node structure navigation for the plant contextualization
Possibility of storing images and pdf files into the static attributes
Models based on Eclipse Ditto with attributes mapped to MQTT signals in Message Bus
Integrates simulations from AI Analytics Run-time component (which integrates Prediction and Optimization Run-time)
Real time data of dynamic attributes displayed in trends
Compatibility with PI System and Eclipse Ditto. The user can create and manage digital twin models based on PI System (a licensed framework for real time systems), or digital twin models based on Eclipse Ditto (an open-source framework)
System Requirements
The following requirements are necessary for the installation and operation of the “Digital Twin Modeler User Interface”.
System and Hardware Requirements
WINDOWS:
Windows 10 64-bit: Pro, Enterprise, or Education (Build 15063 or later)
Hyper-V and Containers Windows features enabled (Docker requirement)
64-bit processor
16GB system RAM
MAC:
MacOS must be version 10.13 or newer
Mac hardware must be a 2010 or a newer model
Software Requirements
Kubernetes cluster with Docker Support:
Helm: Helm is the package manager for Kubernetes that enables quick installations through helm chart files. To get started, check this Link
Associated ZDMP services
Required
Optional
Installation
The stand-alone installation must be performed using Kubernetes as said in section “Software Requirements”. The steps to follow are described below:
Start and configure a Kubernetes cluster. For testing purposes, a Minikube local cluster can be used (Link)
Download the Digital Twin Helm Charts from this Link. Unzip the downloaded file
After unzipping the downloaded file, browse to folder /orchestration/helm-charts and open the file values.yaml. In this file, the different environment variables need to be checked and its URL and port modified to match the corresponding ZDMP component which interacts with the Digital Twin. These environment variables are listed below with a brief description:
DITTO_API_URL, PI_API_URL, STORAGE_API_URL: These three variables must specify the corresponding URLs of the three Digital Twin backend APIs. These three APIs belong to the component Digital Twin
DITTO_URL: This variable must contain the URL of the Eclipse Ditto Backend API which is a free licensed framework (whose installation is specified below) used behind by the Digital Twin
DITTO_DEVOPS_URL: It is the URL of the Eclipse Ditto functions contained into the Eclipse Ditto Backend
PI_WEB_API_URL: It must specify the URL of the PI System server API, only needed if the user is going to work with PI System models
PORTAL_API_URL: It must specify the URL for the backend API of the Portal (ZDMP component)
AI_ANALYTICS_RUNTIME_API_URL: It must specify the URL for the backend API of the AI Analytics Run-time (ZDMP component)
MESSAGE_BUS_URL, MESSAGE_BUS_USERNAME, MESSAGE_BUS_PASSWORD: These variables must specify the URL and credentials for the Message Bus (ZDMP component)
MONGODB_URL: It must specify the URL for the MongoDB database of the STORAGE (ZDMP component)
In the same folder /orchestration/helm-charts and open the file questions.yaml. In this file there is a tag for each of the environment variables mentioned in the previous step. If any variable was modified in the values.yaml it has to be modified in the questions.yaml as well.
Now that the environment variables are set, install the Digital Twin helm charts. To do this, go to the folder /orchestration/helm-charts and execute the following command: *helm install my-release . –namespace my-namespace –set defaultSettings.registrySecret=secretname-cred,privateRegistry.registryUrl=zdmp-gitlab.ascora.eu:8443,privateRegistry.registryUser=username,privateRegistry.registryPasswd=my-token*. The parameters to modify in the previous instruction are the following:
Namespace: Change in the previous instruction “my-namespace” to the namespace to be used. If no namespace is going to be used, then remove “–namespace my-namespace” from the instruction
Username: Change in the previous instruction “username” to your username in Gitlab
My-token: Change “my token” in the previous instruction to your password in Gitlab
In this step, proceed to the installation of the Eclipse Ditto Backend, which is the framework that Digital Twin uses behind. If the port contained in the environment variable DITTO_URL (described above) was modified (it is port 30043 by default), then it must be modified in the file values.yaml (in the line 394) located in folder /orchestration/helm-charts/Eclipse Ditto Backend. Now, to install the Eclipse Ditto Backend helm charts, go to the folder /orchestration/helm-charts/Eclipse Ditto Backend and execute the following commands:
Helm dependency upgrade
Helm upgrade eclipse-ditto . –install
After the installation has finished, the application should be available at http://<your_cluster_IP>:30040
How to use
The Digital Twin Modeler User Interface is a web application tool used to create and edit digital twin models. A digital twin consists of a virtual representation of the manufacturing process, product characterization and simulation. It permits to visualize the status of the manufacturing process or product and its technical functionalities and components. It is possible to simulate future states of the manufacturing process or product.
Models
A model is a hierarchical structure composed by nodes. A node that contains another node below is a parent node, and the node contained is a child node.
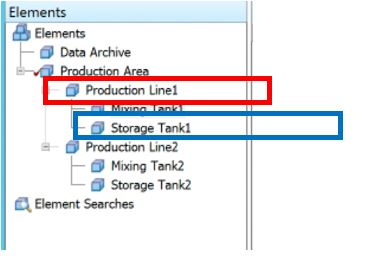
Figure 3. Hierarchical structure of nodes
In Figure 3, the node “Production Area” is a parent node that has two child nodes: “Mixing Tank1” and “Storage Tank1”. Following this, many levels in this hierarchical structure are possible. A node can be an asset, a process, or a product, and it is composed by static and dynamic attributes. For example, in the node “Mixing Tank1” a static attribute is the “Height” (its value is constant), and a dynamic attribute is the “Internal Temperature” (its value is variable).
Getting Started
Once the steps are executed as described in section “Installation”, the Digital Twin Modeler UI is accessible through the browser at http://<your_cluster_IP>:30040. The first step is to connect with the database to read or write from. For this, the user clicks on the configuration tab, as shown in Figure 4:
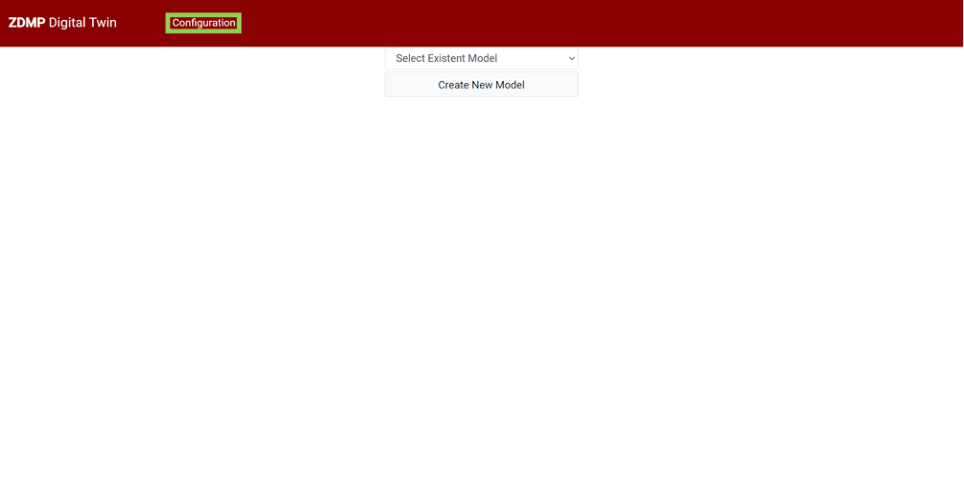
Figure 4. Digital Twin main screen
The user can choose between a PI System Database (a licensed time-series database), or Eclipse Ditto Database (open source), as shown in Figure 5:
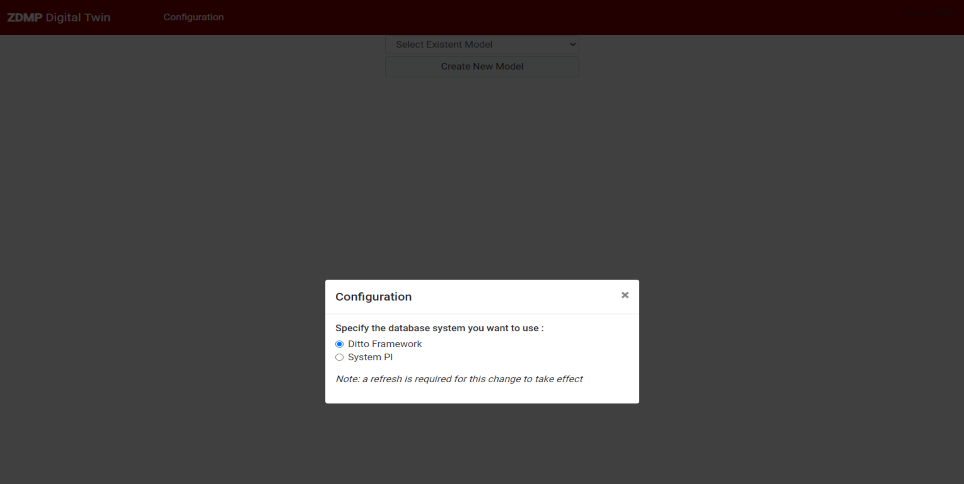
Figure 5. Database system selection
After connecting to the database, all the existing models are displayed in a list:
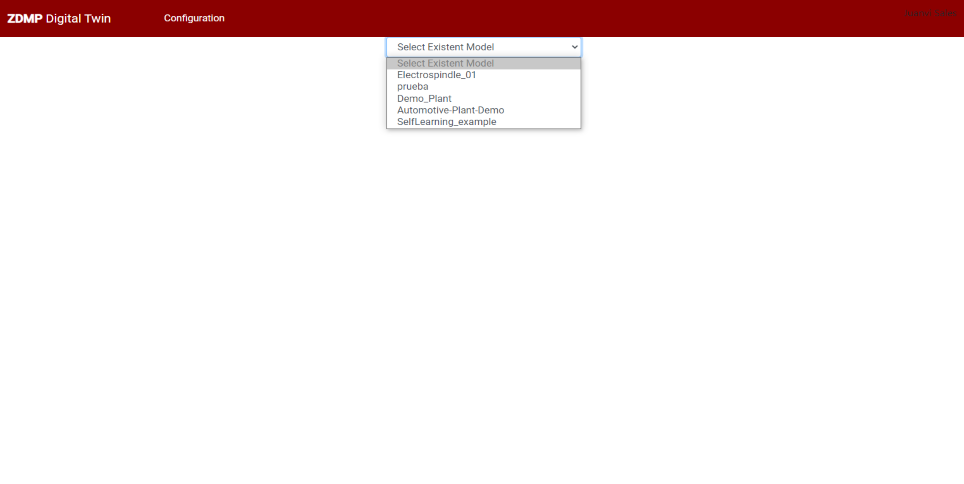
Figure 6. Select existent model
The user can choose the model and the model structure is uploaded:
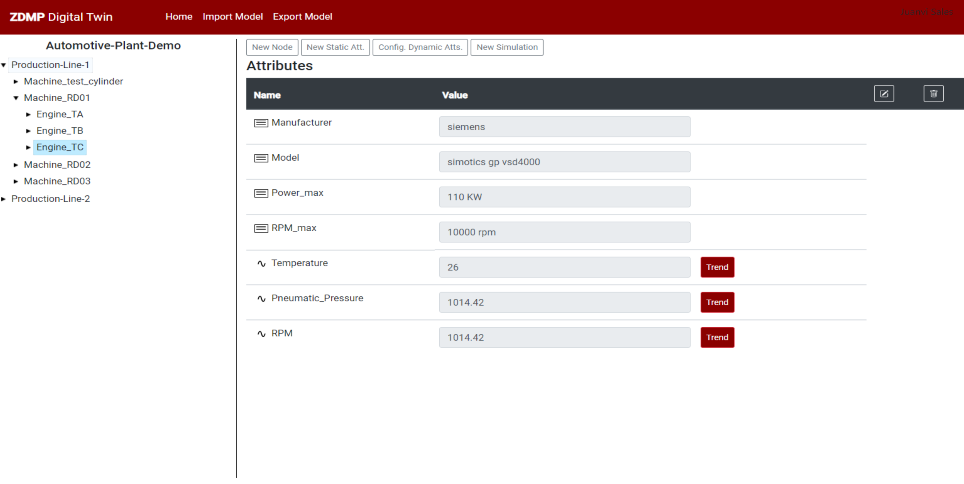
Figure 7. View of a model
On the left side of the screen can be seen and browsed a tree with the nodes structure. When a node is selected (“Engine_TC” in Figure 7), its corresponding attributes can be seen in the centre window. The model’s name is displayed at the top left of the screen (“Automotive_Plant_Demo” in the example).
If the user wishes to exit the model, clicks on “ZDMP Digital Twin” at the top left and then returns to the start screen (Figure 4). To create a new model, the user selects “Create New model” (Figure 4), types the name of the model and clicks on “Create” as shown in Figure 8:
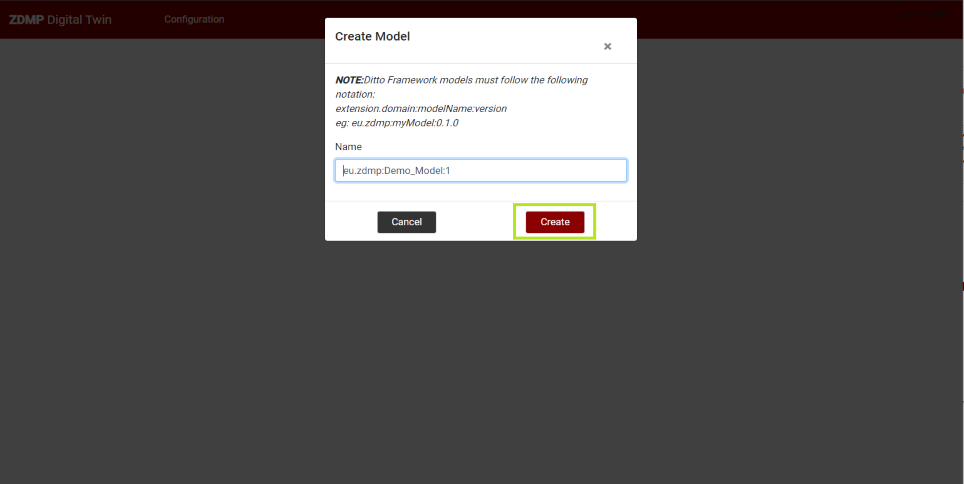
Figure 8. Create a new model (case of model based on Eclipse Ditto)
Figure 8 shows the case of creating a new model based on Eclipse Ditto Framework (see Figure 5), which forces the user to type in the name box following the nomenclature “extension.domain:modelName:version”, where “modelName” is the name of the model. This nomenclature is requirement that is required by Eclipse Ditto Framework.
Nodes
Create a new node in the first level of the tree
Click on “New Node” as shown below:

Figure 9. Create a node as a parent node
If the name of the new node is typed (for example “Production-Line-3”) and then “Create as a first level node” is selected, the node is created in the first level of the tree:

Figure 10. Create a node as a child node
Create a new node contained into an existing node
Select in the tree an existing node that will be the parent node (for example “Production-Line-1”). Then click on “New Node”, type the name of the new node (for example “Machine_L1”) and select “Create as a child node of Production-Line-1”:
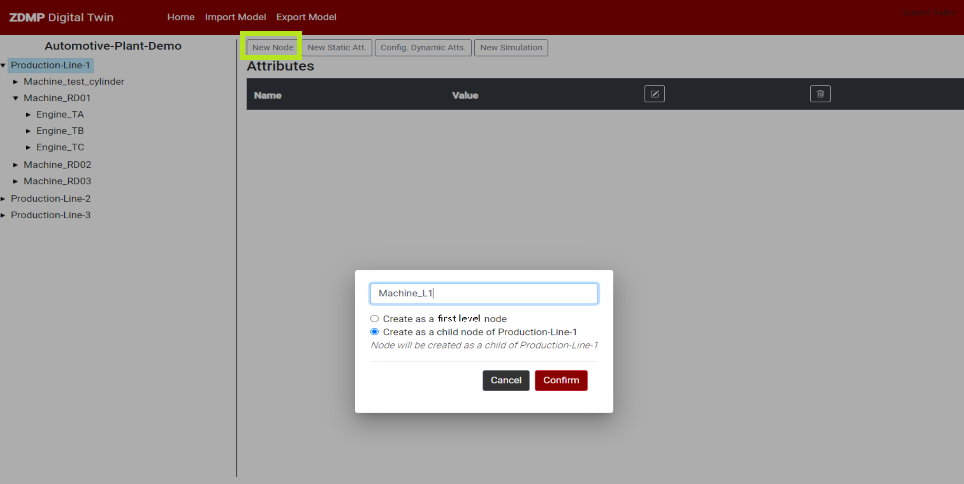
Figure 11. Create a node as a child node
The new node is created as shown in Figure 12:
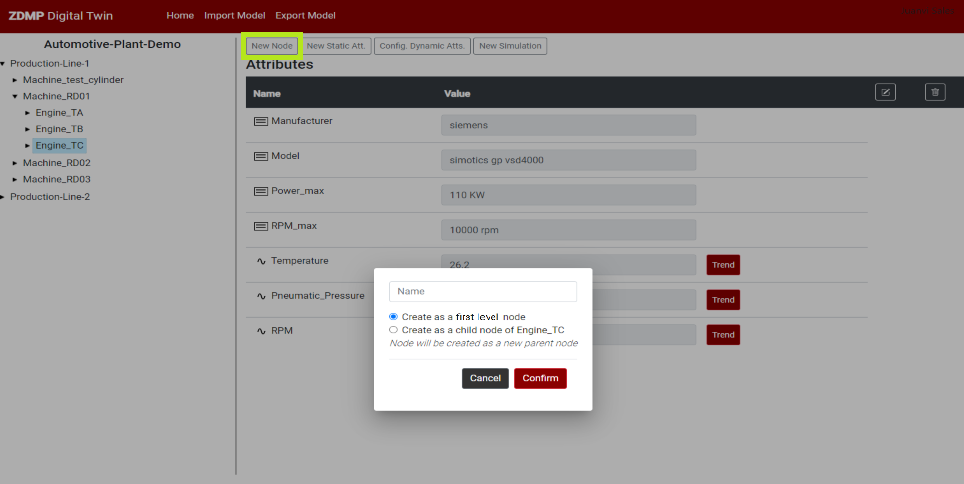
Figure 12. Node created as a child node
Editing a node
Select in the tree the node that will be edited and click the edit icon:
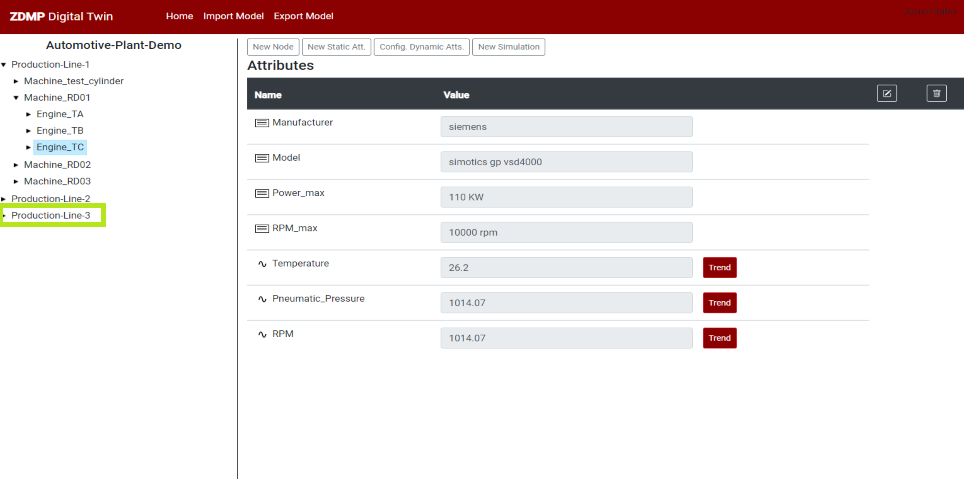
Figure 13. Edit a node
Deleting a node
Select in the tree the node that should be deleted and click the delete icon:

Figure 14. Delete a node
Attributes
Within a node there are the attributes, which can be static attributes or dynamic attributes.
Static attributes: The attribute value remains constant. The static attributes can be of three types: value (a real number or a string), image (image file which can be visualized) or pdf (the typical datasheet in pdf). Figure 15 shows these types of static attributes and their identifying symbol that differentiates them
Dynamic attributes: The attribute is a real time signal, and its value varies with time. In the example (Figure 15), dynamic attributes are “Temperature”, “Pressure”, and RPM
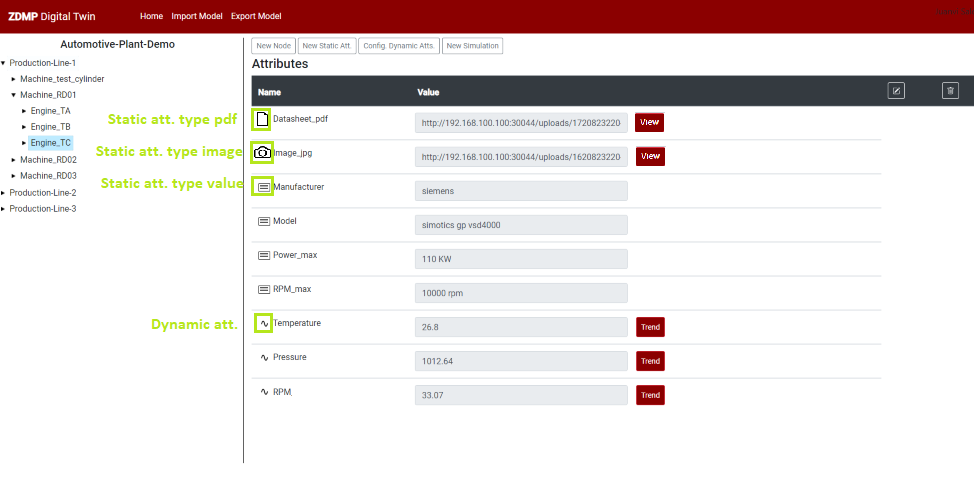
Figure 15. Static and dynamic attributes
- Trend: With all dynamic attributes can be displayed its trend clicking on the corresponding “trend” button as shown in Figure 16:
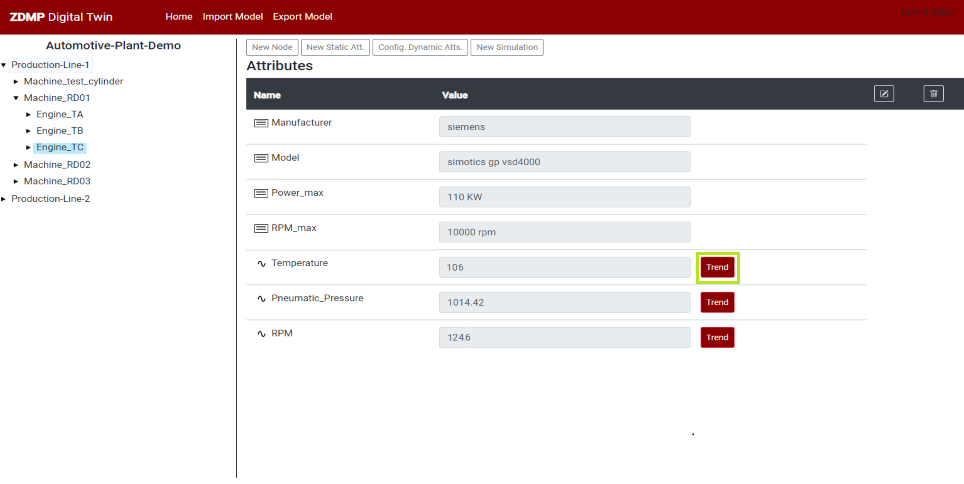
Figure 16. Button “Trend”
The trend, by default, comprises a time slot from now up to 24 hours backwards:
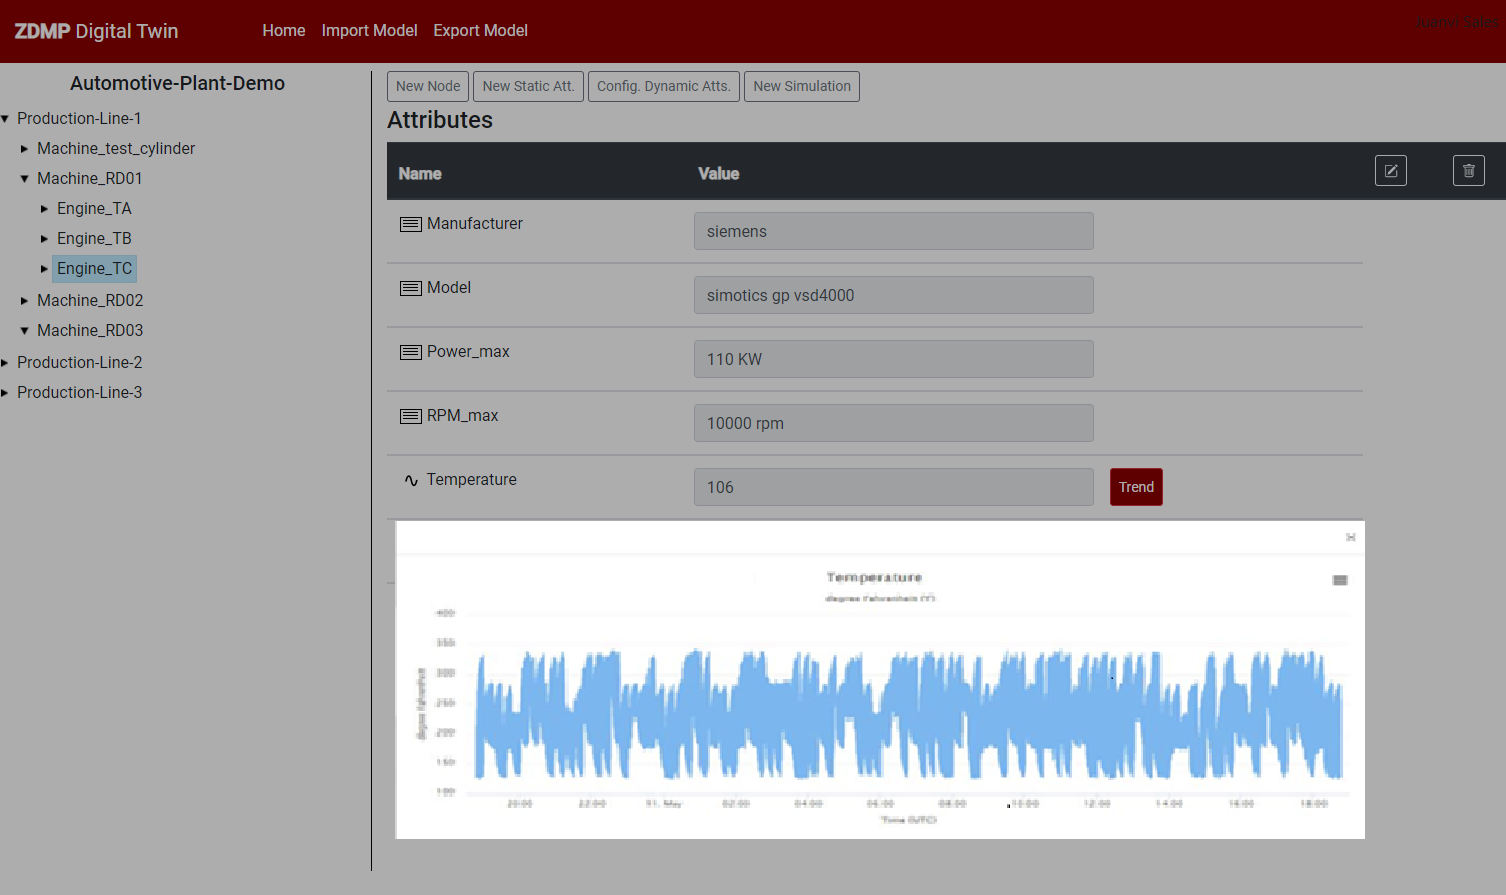
Figure 17. Trend
The time interval can be chosen by dragging the mouse with the left button pressed on the piece of trend to inspect. When the mouse button is released, the new trend is displayed:

Figure 18. Adjustment of the time interval of the trend
Positioning the cursor on the trend the numeric value of the attribute and its corresponding time stamp is shown.
Creating a new static attribute
Select in the tree an existing node (within which the static attribute will be created) and click in “New Static Att.”, as shown in Figure 19. A pop-up window appears with the corresponding fields to fill in:

Figure 19. Create a static attribute
In the first tab corresponding to the attribute type, by clicking on the drop-down the user selects the type of attribute (value, image, or pdf) as shown in Figure 20:

Figure 20. Select the attribute type of a new static attribute
In case the attribute is of type “value”, the user types the name, the value, and the units. If the attribute is of type “image” or “pdf” the user types the name and select the corresponding file (from the local computer for example) as shown in Figure 21:
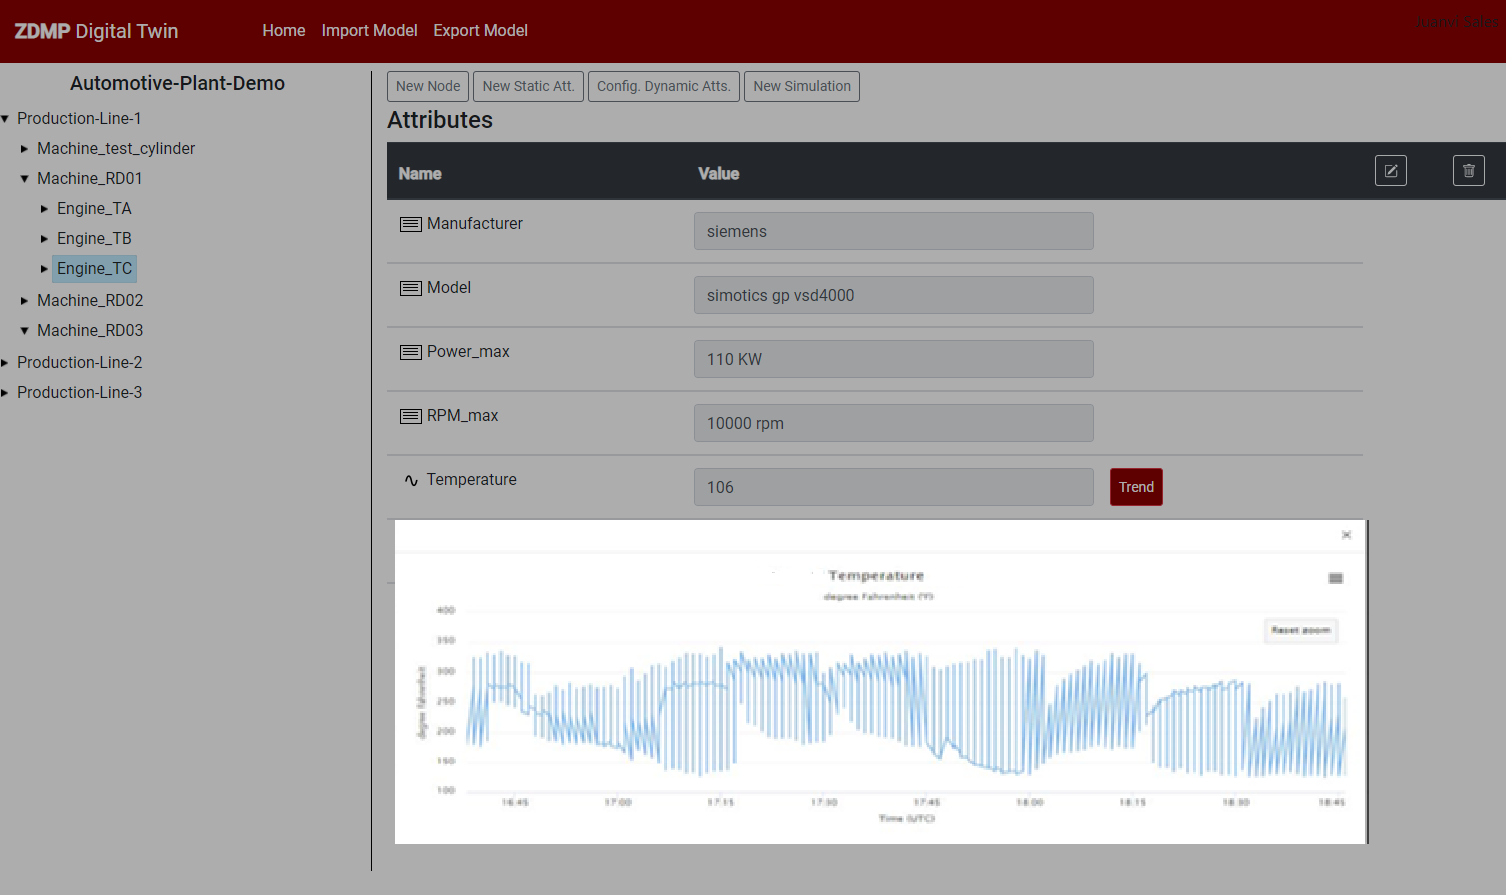
Figure 21. New static attribute of type image
To display an image or a pdf file contained in a static attribute the user clicks on the “View” button as shown in Figure 22:
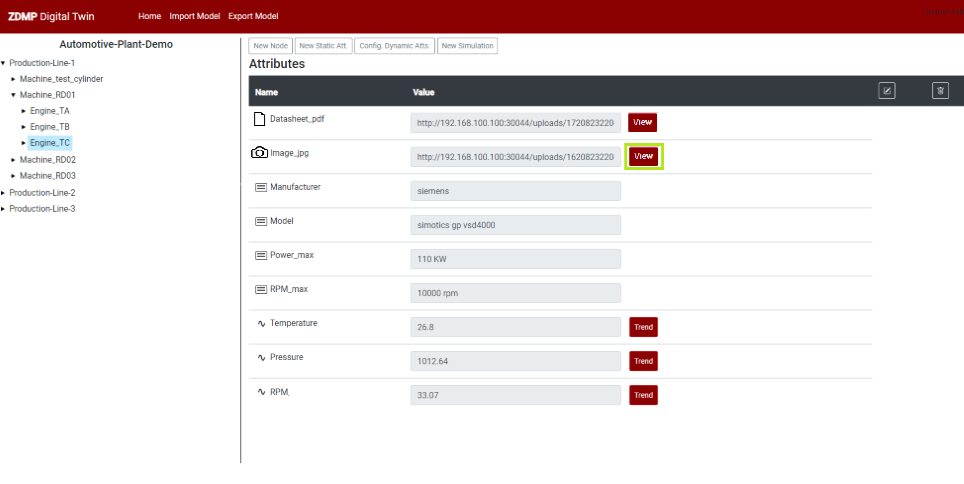
Figure 22. Button “View” of a static attribute (type image)
In this case, since it is an image, the image is displayed in a pop-up window as shown in Figure 23:
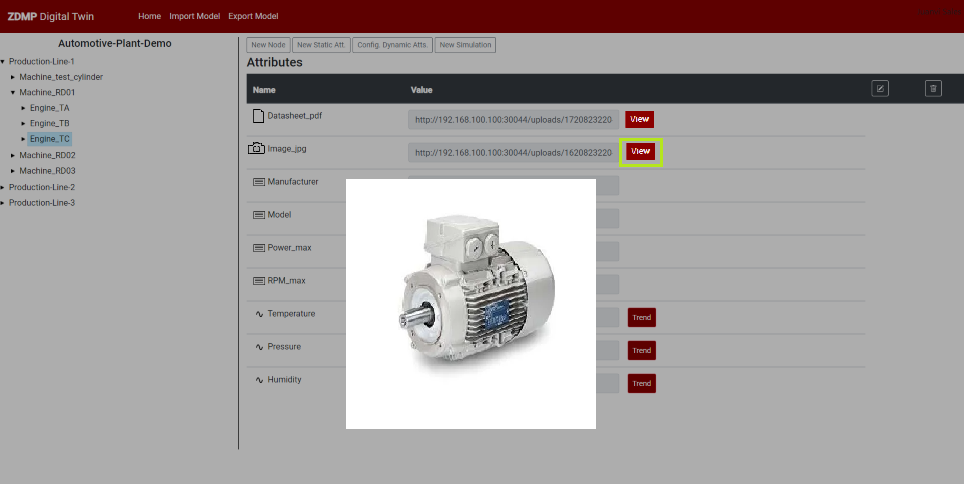
Figure 23. Pop up window with the image
In the case of a pdf file, when the user clicks on the “View” button, a new tab opens in the browser with the corresponding pdf, thus allowing a better visualization of the documentation.
Creating and configuring a new dynamic attribute in a model based on PI System
Select in the tree an existing node (within which the dynamic attribute will be created) and click on “Config. Dynamic Atts.” to access the configuration window. In case the model is based on PI System the pop-up window is as shown in Figure 24, with the corresponding fields to fill in.

Figure 24. Configuration of a dynamic attribute in a model based on PI System
In the field “Name” the user types the attribute name. The field “Data Reference” is where the user types the tag name of the real time signal in the PI System database, so that the dynamic attribute will be mapped to this real time signal.
Creating and configuring a new dynamic attribute in a model based on Eclipse Ditto
In case of the model is based on Eclipse Ditto it has the particularity that a thing (node) only can be connected to a unique MQTT topic. That is, Ditto framework connects one thing to one MQTT message, existing the possibility that within this message several signals are included.
Select in the tree an existing node (within which the dynamic attribute will be created), click on “Config. Dynamic Atts.” and the configuration window appears as shown in Figure 25:

Figure 25. Configuration of a dynamic attribute in a model based on Eclipse Ditto
- Case 1: MQTT topic message contains only the value. In this case, as the MQTT message consists only of the value, for the mapping only the topic is necessary. The user clicks on “Simple Topic (no JSON)” and the pop-up window change as shown in Figure 26, so that only the fields “Message Bus Topic” and “Signal Name” (attribute name) have to be filled in
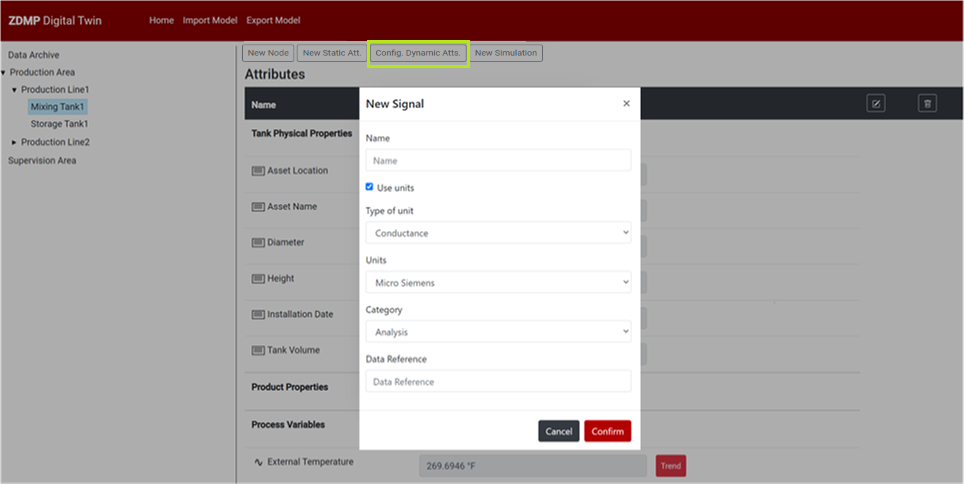
Figure 26. Configuration of a dynamic attribute when topic contains only the value
- Case 2: the MQTT topic message contains one or more signals within a JSON object. In this case, as the MQTT message is a JSON object which can have a structure that does not follow any standard, the unique way to map the desired signal is typing in JavaScript language the instruction to extract a data from a JSON object. For example, suppose there is a topic called “cetek” whose MQTT message is the one shown in Figure 27:

Figure 27. Example of MQTT message with several signals
To map the temperature value in this example (to obtain the value 29.8), the user has to type in the field “JavaScript mapping” the following: “jsonData.devices[0].fields.find(x => x.name == ‘Temperature’).value”
To complete the configurations the user fills in the fields “Message Bus Topic” (“cetek” in the example) and “Signal Name” with the name of the attribute (“Temperature” in the example), as shown in Figure 28:
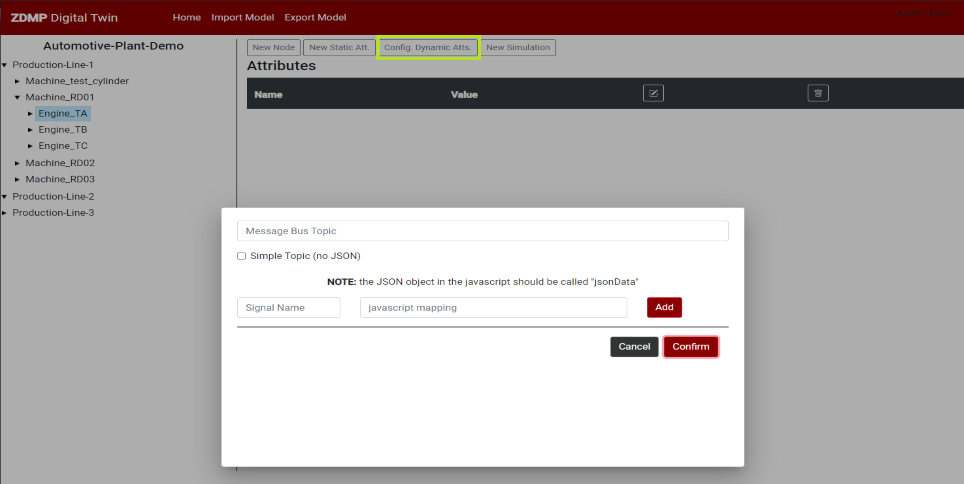
Figure 28. Configuration of a dynamic attribute when the MQTT topic message contains one or more signals within a JSON object
When the user clicks on “Add”, the attribute “Temperature” is added to a list below as shown in Figure 29. Then the user can add a new attribute if needed, mapping this new attribute to another signal within this MQTT topic.
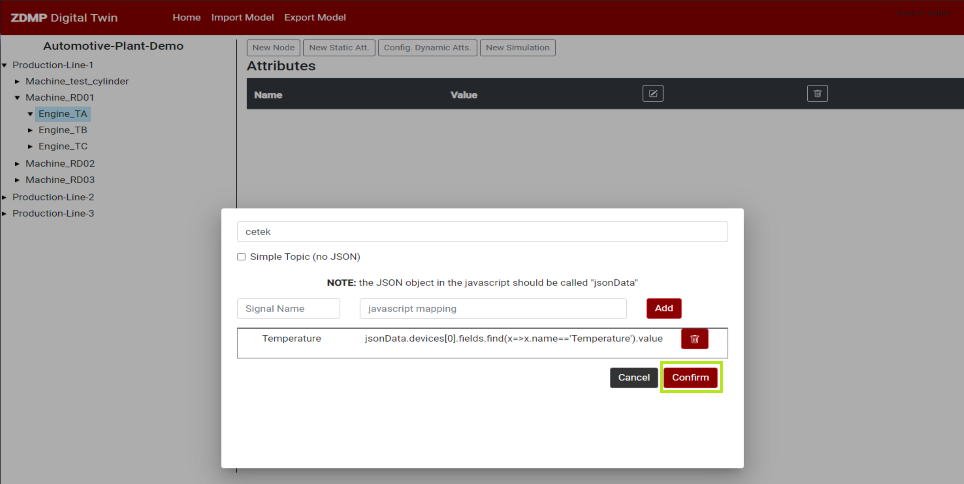
Figure 29. Configuration of a dynamic attribute when the MQTT topic message contains one or more signals within a JSON object (final step)
Once the configuration is finished, the user clicks on “Confirm” and the dynamic attribute is created within the corresponding node:
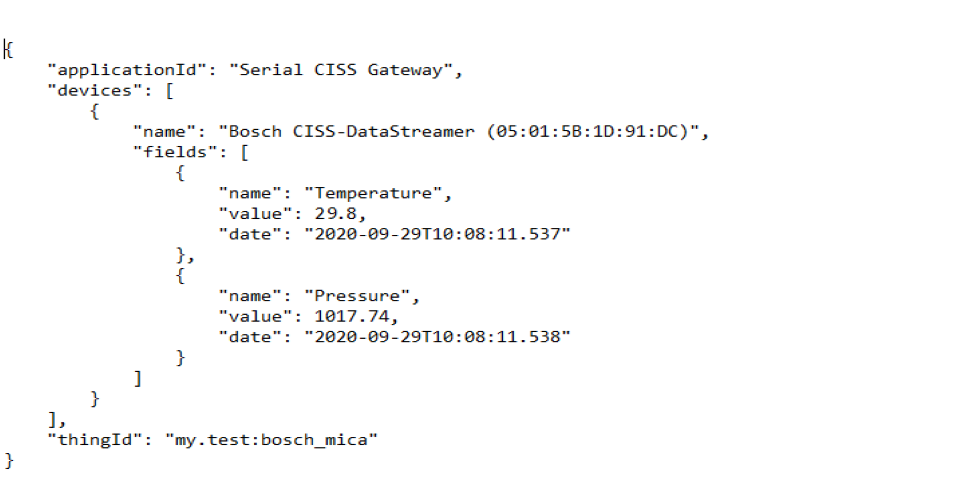
Figure 30. New dynamic attribute created mapped to a signal in MQTT topic message
Editing or deleting an attribute in a model based on PI System
Click on the corresponding attribute (static or dynamic) and a pop-up window appears. After editing the required fields click on “save changes”, as shown in the image below:
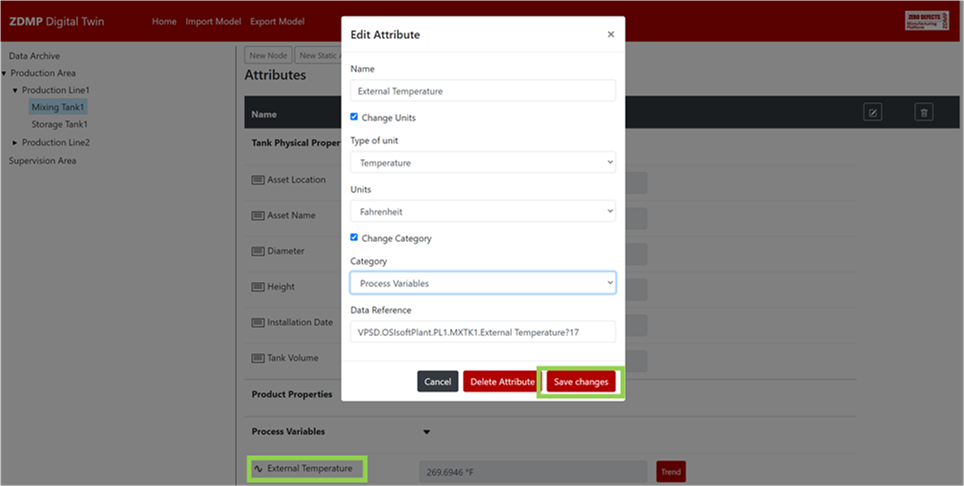
Figure 31. Editing an attribute in a model based on PI System
In the same way, to delete the attribute, click on the button “Delete Attribute”.
Editing or deleting an attribute in a model based on Eclipse Ditto
In the same way, as in the previous section, the user clicks on the corresponding attribute (static or dynamic) and a pop-up window appears allowing to edit the attribute or delete the attribute.
The most complex case is the one corresponding to a dynamic attribute mapped to a MQTT message which can contain one or more signals. In this case, shown in Figure 32, to change the attribute name or change the “JavaScript mapping”, the user has to delete the corresponding attribute from the list and then add a new one.
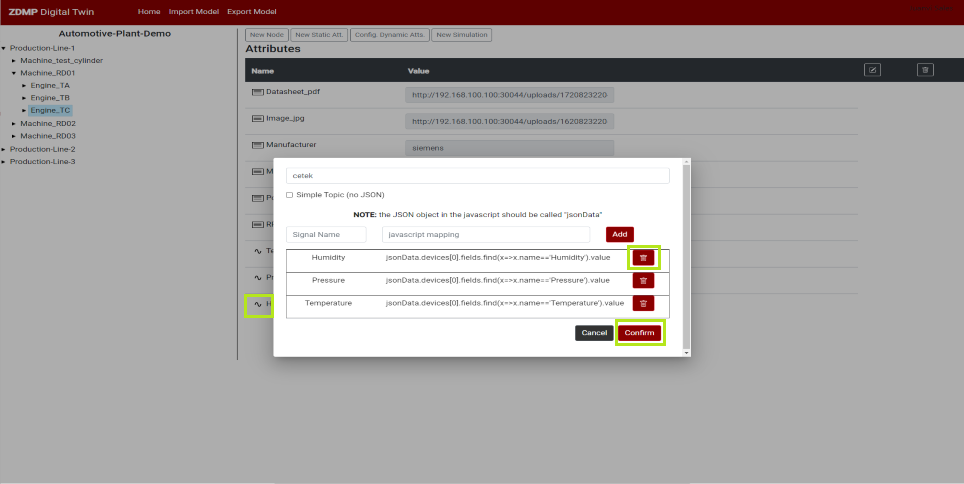
Figure 32. Editing or deleting an attribute in a model based on Eclipse Ditto
Export / Import a model
Export
In the Section “Getting Started” it described how to upload a model. A model can also be exported to a file by clicking on “Export Model” as shown in the image below:

Figure 33. Export a model
If the model is based on System Pi, then an XML file with name “export.xml” is created and stored in the user computer in the folder “Downloads”. If the model is based on Eclipse Ditto then a JSON file with name “export.json” is created and stored in the user computer in the folder “Downloads”.
Import
Currently this functionality is only available for models based on PI System. Clicking on “Import Model”, the user can browse the folders and select the XML file with the model to load:

Figure 34. Import a model
Simulation
A simulation is a process where introducing input data generates as a result output data. Simulations are based in mathematical algorithms to emulate a real system, and in this way, it is possible to make future predictions, to observe the system behaviour, etc.
A simulation only works in Digital Twin models based on Eclipse Ditto (not System PI), so that the Digital Twin communicates with the corresponding API which manages the simulation models available in the ZDMP platform.
The required steps to run a simulation are described below.
Choose a node and create a simulation
First, select a node in the tree, so that the simulation results will be displayed in a new node created within the selected node (as shown in the section “Simulation results”).
Once the node is selected, (”Cylinder_Tester_1” in the example) click on “New Simulation” as shown in the following image:
Figure 35. Create a simulation
Wizard to configure and run the simulation
Now there is a wizard with four steps to configure and run the simulation. Once a step is completed, the user goes to the next one by clicking “Next”. To go back then the user clicks “Back”.
- Simulation type: Clicking on the dropdown all (see Figure 36) the available models are shown, and one can be selected. These available models are provided by the AI Analytics Run-time, which also includes the models from Prediction and Optimisation Run-time (since Prediction and Optimisation Runtime is integrated into AI Analytics Run-time). These models have been previously built using the ZDMP component AI Analytics Designer, or using the component Prediction and Optimisation Designer, and have been uploaded to the AI Analytics Run-time using the Model Deployment Manager. In the example, the “Simulation Type” selected is “Leak_Prediction” as shown in Figure 36.
Figure 36. Select a simulation model
- Inputs: In this second step, those data inputs required by the simulation model are shown. The MQTT topic of each input (where the simulation model reads from) is automatically displayed, and the user types the corresponding dynamic attribute. In the example (Figure 37) there is only one input with the MQTT topic “Input_pressure” and the user has typed the attribute name “Pressure”

Figure 37. Mapping a dynamic attribute to the input of the simulation model
- Outputs: In this third step, those data outputs where the simulation model sends the results are shown. The MQTT topic of each output is automatically displayed, and the user types the corresponding dynamic attribute. In the example (Figure 38) there is only one output with the MQTT topic “output_leak_prediction” and the user has typed the attribute name “Leak_Probability”
Figure 38. Mapping a dynamic attribute to the output of the simulation model
- Confirmation: In this fourth step, the data configured in the previous steps is shown so that the user can check it. By clicking on “Confirm” the simulation model runs, and if it is successful a message appears at the top as shown in the following image
Figure 39. Confirm the simulation wizard has finished
Simulation results
Once the simulation wizard is finished, new child nodes are created within the selected node to display the simulation results. As many nodes are created as involved MQTT messages (message bus topics), since in DITTO a thing (node) can only be connected to a single MQTT message.
In the example, the selected node when starting the simulation wizard was “Cylinder_Tester_1” (view section “Choose a node and create a simulation”). Figure 40 shows the three new nodes created in the tree as a result of the simulation.
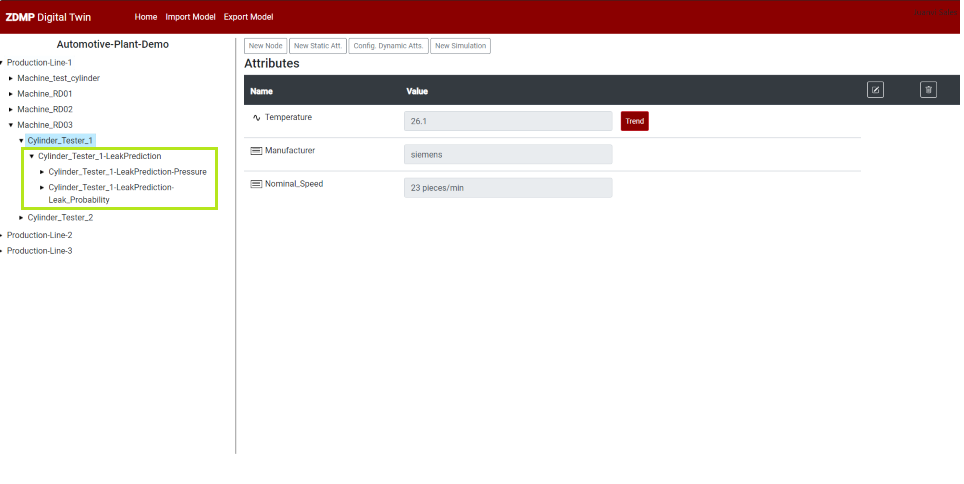
Figure 40. Nodes created as a result of the simulation
The Figure 41 shows the attribute “Pressure” within the node “Cilinder-Tester_1-LeakPrediction_Pressure”. Note that this node name can be changed by the user if necessary.
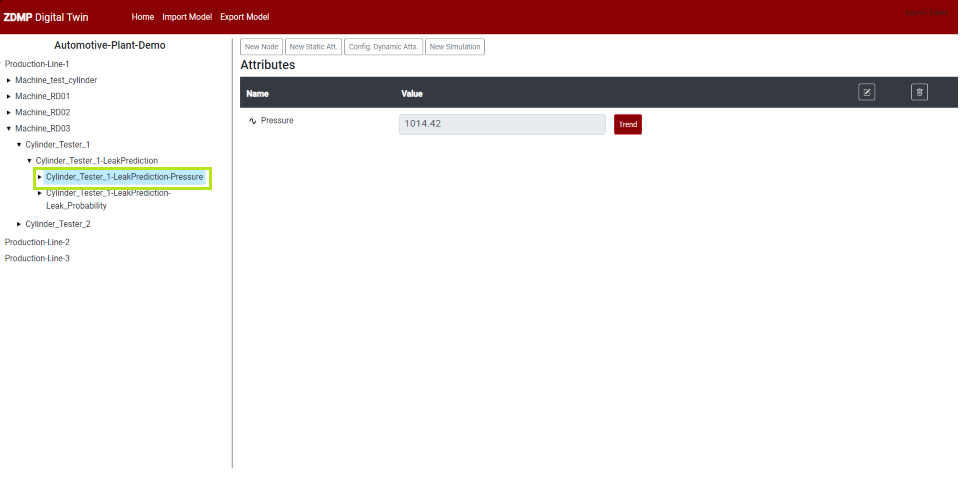
Figure 41. Node created as a result of the simulation which contains the input
Figure 42 shows the simulation result in the attribute “Leak_Probability”:
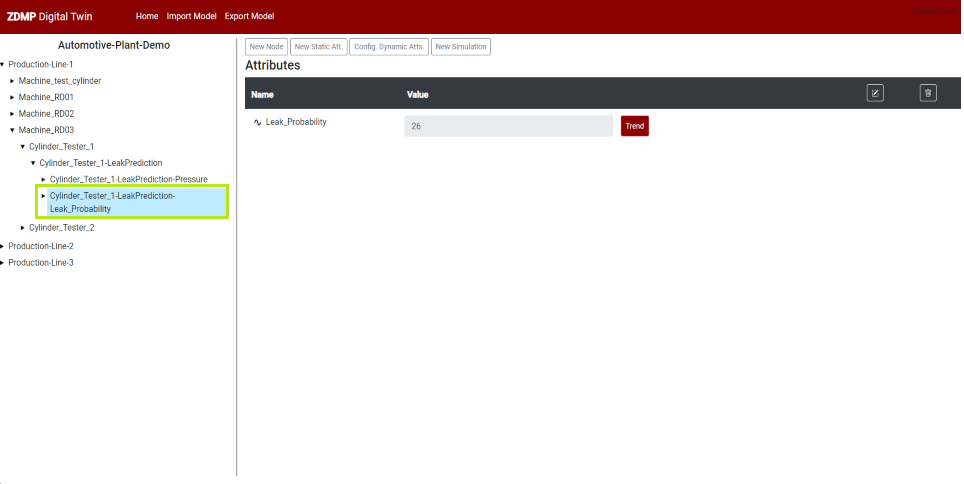
Figure 42. Node created as a result of the simulation which contains the output